
Figures & data
Figure 1. The read coverage depth map of Dolichopus galeatus.
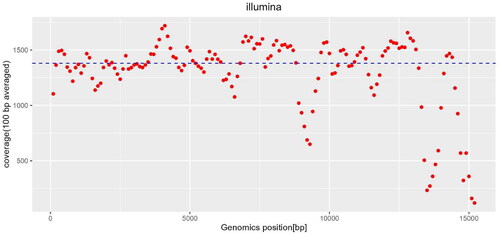
Figure 2. Maximum-likelihood analysis of 13 PCGs was used to estimate the evolutionary connections of Dolichopus galeatus and 10 species. GenBank accession numbers of all sequences used in the phylogenetic tree have been included in the figure and corresponding to the names of all species. Newly sequenced data in this study are in red color.
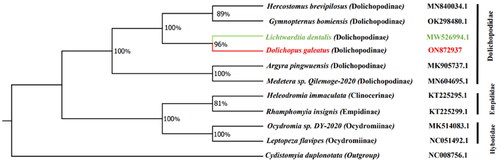
Figure 3. Picture of Dolichopus galeatus species (this picture was taken by the corresponding author, Ning Wang).
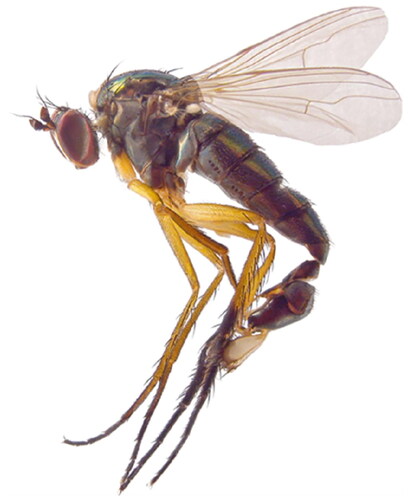
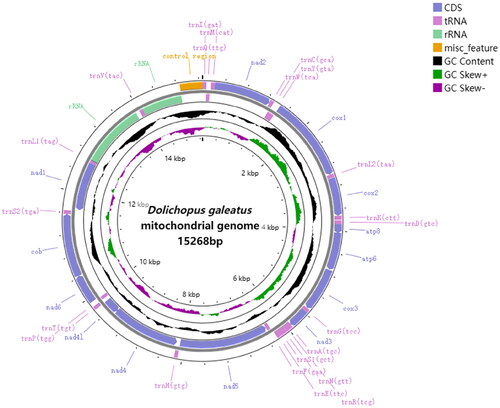
Figure 4. Genome map of Dolichopus galeatus.
Data availability statement
The genome sequence data that support the findings of this study are openly available in GenBank of NCBI (https://www.ncbi.nlm.nih.gov/) under the accession no. ON872937. The associated BioProject, Sequence Read Archive (SRA), and Bio-sample accession numbers are PRJNA894116, SRR22097498, and SAMN31438012, respectively.