
Figures & data
Figure 1. Clitellate specimen of Dendrobaena veneta. The photograph was taken in Piliscsaba, Hungary by the first author Csaba Csuzdi on 20 June 2022.
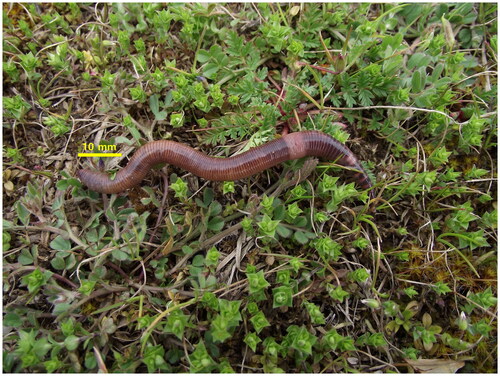
Figure 2. Circular sketch map of the Dendrobaena veneta mitogenome. The mitogenome map was generated using the GenBank format of the sequence (OQ763213) with the online Proksee software (Grant et al. Citation2023). From the inside to the outside, the innermost scale indicates the length, the inner circle indicates the GC skew, the Middle circle indicates the GC content, and the outer circle indicates gene arrangement. The plots of the GC content and GC skew were generated by default setting of the software (window 500, step 1). different colors represent different gene blocks.
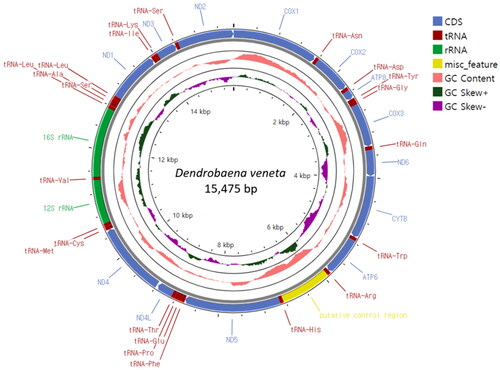
Figure 3. Phylogenetic tree of the 26 species of the Megascolecidae and Lumbricidae. Phylogenetic trees were reconstructed using maximum-likelihood (ML) and Bayesian inference (BI) methods, based on the nucleotide sequence of 13 PCGs. The sequences used in the tree are listed in . The numbers at each node specify the BI posterior probability and ultrafast bootstrap support (%), respectively. The scale bar indicates the number of substitutions per site.
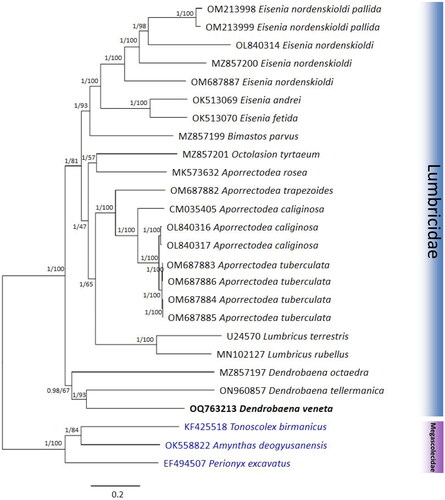
Table 1. List of metagynophora mitogenomes used in this study.
Supplemental Material
Download MS Word (100.6 KB)Data availability statement
The genome sequence data that support the findings of this study are openly available in GenBank of NCBI under accession No. OQ763213. The associated BioProject, SRA, and Bio-Sample numbers are PRJNA769829, SRR24457999, and SAMN34844758, respectively.