
Figures & data
Figure 1. Images of the Allium species. Photographs of the reference images were taken by the authors at the Baekdudaegan National Arboretum, South Korea, without any copyright issues. Seeds were provided by Baekdudaegan National Arboretum Seed bank and propagated in the Baekdudaegan National Arboretum. (A) A. sacculiferum Maxim. (B) A. thunbergii G. Don. (C) A. taquetii H. Lév. & Vaniot.
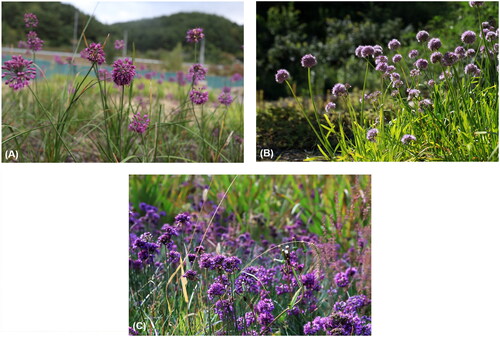
Figure 2. The phylogenetic tree reconstructed using MEGA based on 21 complete chloroplast genome sequences inferred using the maximum-likelihood (ML) method. All sequences were downloaded from NCBI GenBank. The sequences used for phylogenetic tree construction are as follows: A. cepa (MK335926.1; Huo et al. Citation2019/KM088013.1, KM088014.1, KM088015.1; Kim et al. Citation2015), A. sativum (NC_031829.1/KY363332.1/MK335928.1; Huo et al. Citation2019), A. fistulous (MK335927.1; Huo et al. Citation2019/NC_040222.1; Kim et al. Citation2015/MH926357.1; Yusupov et al. Citation2019), A. koreanum (MT348449.1; Namgung et al. Citation2021), A. ochotense (MT348451.1; Namgung et al. Citation2021), A. senescens (MT348450.1; Namgung et al. Citation2021), A. hookeri (MZ557488.1; Ren et al. Citation2022), A. macrostemon (MK75472.1; Xie et al. Citation2019), A. ampeloprasum (NC_044666.1), Agapanthus coddii (NC_035971.1), and Acorus americanus (EU273602.1). The numbers above the nodes indicate bootstrap support values (with 1000 replicates). The numbers under the nodes indicate the length of each node.
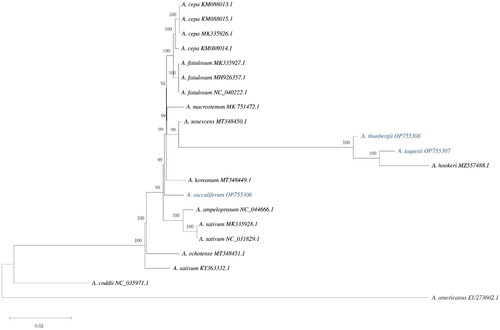
Figure 3. Chloroplast genome map of A. sacculiferum. The center of the map indicates the species name and length of the chloroplast genome. The outer circle represents the genes, and the inner circle represents the size of the IRs, LSC, and SSC, respectively. Genes with diverse functions are shown in different colors. The dark grey plot of the inner circle represents the GC content, and the grey line in middle represents the 50% threshold.

Figure 4. The chloroplast genome map of A. thunbergii. The center of the map indicates the species name and length of the chloroplast genome. The outer circle represents the gene, and the inner circle represents the size of the IRs, LSC, and SSC, respectively. Genes with diverse functions are shown in different colors. The dark grey plot of the inner circle represents the GC content, and the grey line in middle represents the 50% threshold.
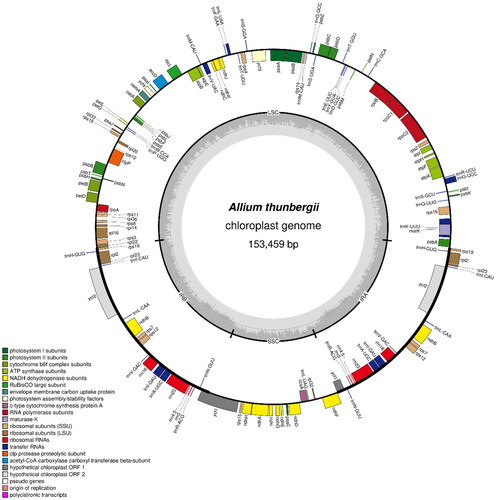
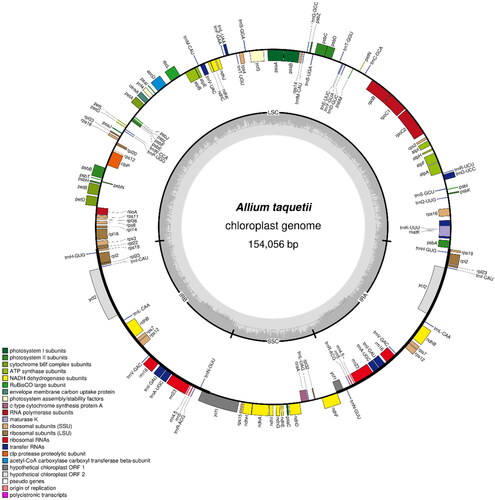
Figure 5. The chloroplast genome map of A. taquetii. The center of the map indicates the species name and length of the chloroplast genome. The outer circle represented the genes, and the inner circle represented the size of the IRs, LSC, and SSC, respectively. Genes with diverse functions are shown in different colors. The dark grey plot of the inner circle represents the GC content, and the grey line in middle represents the 50% threshold.
Supplemental Material
Download MS Word (1.3 MB)Data availability statement
The genome sequence data of Allium sacculiferum, A. thunbergii, and A. taquetii that support the findings of this study are openly available in the GenBank of NCBI at https://www.ncbi.nlm.nih.gov/, under accession nos. OP755306, OP755308, and OP755307, respectively. The BioProject, SRA, and Bio-Sample numbers for A. sacculiferum are PRJNA822879, SRR18707531, and SAMN27281643, respectively; for A. thunbergii are PRJNA822879, SRR18707530, and SAMN27281644, respectively; and for A. taquetii are PRJNA822879, SRR18707529, and SAMN27281645, respectively.