
Figures & data
Figure 1. Oreocharis argyreia var. angustifolia Growing in its natural habitat at Mount Jiulian of Longnan County, Jiangxi Province of China. (A) the whole plant; (B) leaf; (C) corolla. Photos by G. Xu.
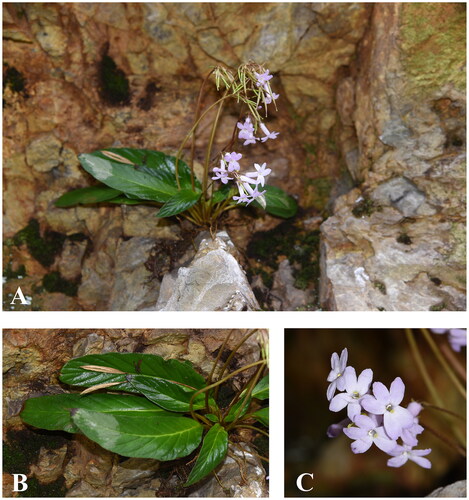
Figure 2. Complete plastome map of Oreocharis argyreia var. angustifolia. Chloroplast genome map of Christella dentata. From the center outward, the first track shows the dispersed repeats, in which the forward (D) and palindromic (P) repeats are connected with red and green arcs. The second track shows the long tandem repeats as short blue bars. The third track shows the short tandem repeats or microsatellite sequences as short bars with different colors that correspond to their repeat unit size: Black: complex repeat; green: repeat unit size = 1; yellow: repeat unit size = 2; purple: repeat unit size = 3; blue: repeat unit size = 4; orange: repeat unit size = 5; red: repeat unit size = 6. The small single-copy, inverted repeat, and large single-copy regions are shown on the fourth track. The GC content along the genome is plotted on the fifth track. The genes are shown on the sixth track, while the optional codon usage bias is displayed in the parenthesis after the gene name. Genes are color-coded by their functional classification (bottom left corner), while the transcription directions for the inner and outer genes are clockwise and anticlockwise, respectively.
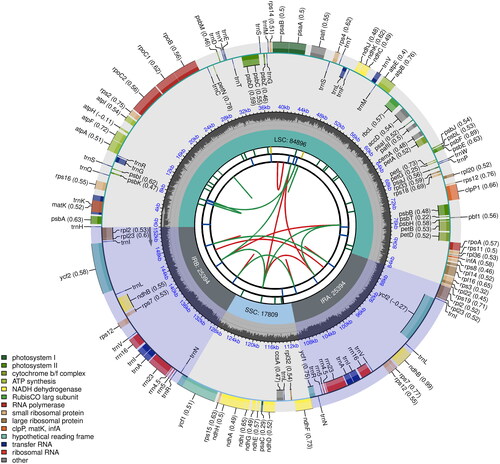
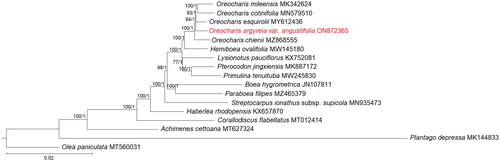
Figure 3. Phylogenetic tree based on the 79 shared unique CDS of 13 selected taxa of Gesneriaceae, with Olea paniculata and Plantago depressa included as outgroups. Shown next to the nodes are the bootstrap support (BS) and posterior probability (PP) values, in which strong branch support (BS ≥75%, left; PP ≥0.95, right) is indicated with an asterisk (*).
Supplemental Material
Download TIFF Image (2.3 MB)Supplemental Material
Download TIFF Image (379.6 KB)Data availability statement
The genome sequence data that support the findings of this study are openly available in GenBank of NCBI at http://www.ncbi.nlm.nih.gov under the accession number ON872365. The associated BioProject, SRA, and BioSample numbers are PRJNA772562, SRR19924869, and SAMN29409930, respectively.