
Figures & data
Figure 1. The plant of C. nervosus. A whole plant; B inflorescences and fruits. The plant individual has bright yellow long filamentous anther connectives. The photographs were taken by Yong-Bin Lu in Guilin Botanical Garden, Guangxi, China (25°04′36″ N, 110°18′21″ E).
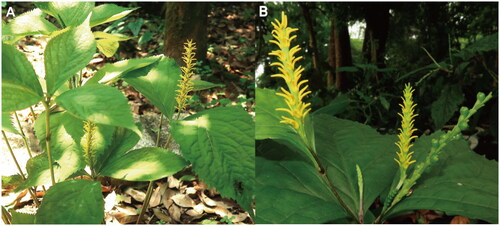
Figure 2. Circular chloroplast genome map of C. nervosus. The map is made up of six circles. Starting from the center, the first circle represents the distribution of repeats. The second circle denotes the tandem repeats with short bars. Short bars in the third circle indicate microsatellite sequences. The positions of the LSC, SSC, IRa, and IRb regions are indicated on the fourth circle. The fifth circle shows the GC content. Genes with different functions are color-coded on the sixth circle, and the optional codon usage bias is shown in parentheses after the gene name.
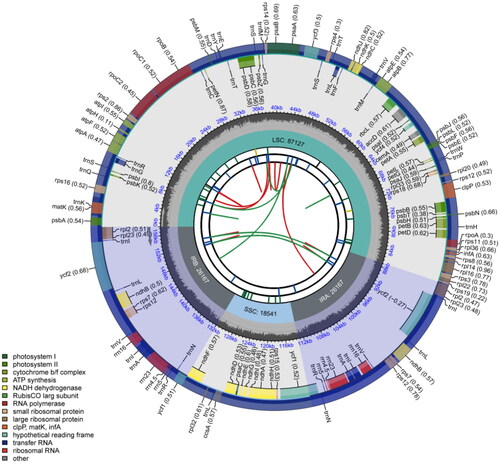
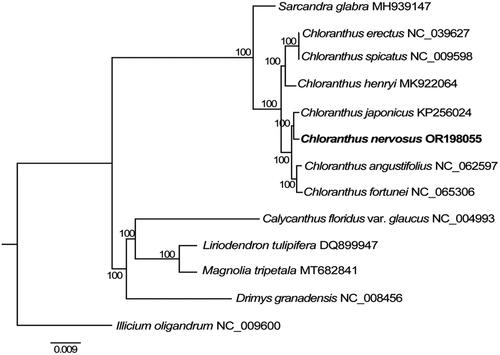
Figure 3. The maximum-likelihood (ML) tree was constructed based on the eight chloroplast genome sequences. The bootstrap support values are shown above branches. The following sequences were used: Chloranthus erectus NC_039627 (Zeng et al. Citation2018), C. spicatus NC_009598 (Hansen et al. Citation2007), C. henryi MK922064 (Liu et al. Citation2019), C. japonicus KP256024 (Sun et al. Citation2016), C. nervosus OR198055 (this study), C. fortunei NC_065306 (Kang et al. Citation2022), Sarcandra glabra MH939147 (Wang et al. Citation2020). Calycanthus floridus var. glaucus NC_004993 (Goremykin et al. Citation2003), Liriodendron tulipifera DQ899947, Magnolia tripetala MT682841, Drimys granadensis NC_008456 (Cai et al. Citation2006), and Illicium oligandrum NC_009600 (Hansen et al. Citation2007).
Supplemental Material
Download MS Word (218.3 KB)Data availability statement
The genome sequence data that support the findings of this study are openly available in GenBank of NCBI at (https://www.ncbi.nlm.nih.gov/) under accession no. OR198055. The associated BioProject, SRA, and Bio-Sample numbers are PRJNA990663, SRR25131669, and SAMN36271954, respectively.