
Figures & data
Figure 1. Adult of Ptomascopus plagiatus (Ménétriés, 1854) (photographed by shutong dai). This species has an orange-red rectangle band on each elytra. The dorsal plate of anterior thorax has dense grayish-yellow appressed hairs. The Middle tibiae are straight or slightly curved, and the hind tibiae are straight. Bar = 1 cm.
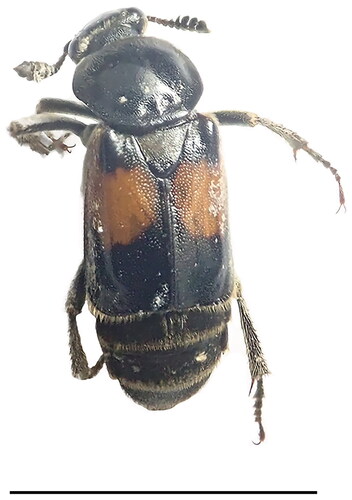
Table 1. List of the mitochondrial genomes used in phylogenetic analysis.
Figure 2. Mitochondrial genome map of Ptomascopus plagiatus (Ménétriés, 1854) displaying both heavy (outside the circle) and light (inside the circle) strands. The transcriptional directions of genes located on the heavy and light strands are clockwise and counterclockwise, respectively. Plots of GC content and skew used a sliding window size of 500 and step size of 1. GC skew is plotted using green and purple sliding windows as the deviation from the average of the mitochondrial genome.
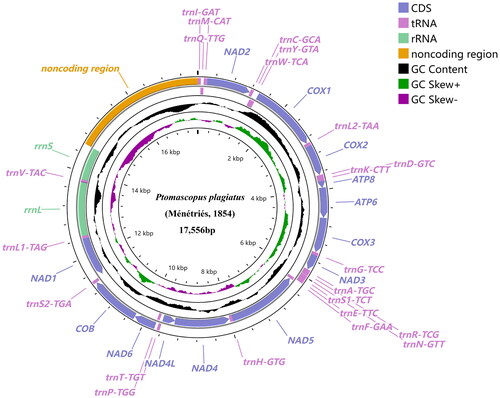
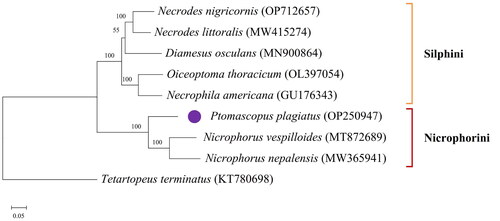
Figure 3. ML tree was constructed using mitochondrial genome sequences of 8 species from the Silphinae and an outgroup species using RAxML v8.2.10 software. Numbers at nodes indicate bootstrap values. GenBank accession numbers are given adjacent to the species name.
Supplemental Material
Download Text (117.2 KB)Supplemental Material
Download MS Word (93 KB)Data availability statement
Mitogenome data supporting this study are openly available in GenBank at nucleotide database, https://www.ncbi.nlm.nih.gov/nuccore/OP250947.1. The associated BioProject, SRA, and BioSample numbers are PRJNA876787, SRR21634603, and SAMN30815897, respectively.