
Figures & data
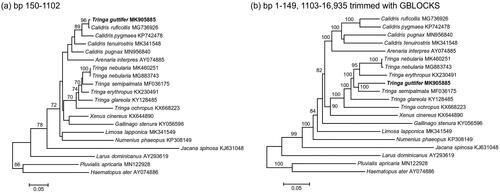
Figure 1. ML phylogenies of shorebirds (Charadriiformes) based on (a) positions 150–1102 (953 bp) of the mitogenome, (b) mitogenomes excluding positions 150–1102 and trimmed with GBLOCKS (14,346 bp). Numbers along branches represent bootstrap support values (>70%) based on 1000 pseudoreplications. Note the different position of T. guttifer in the two gene trees.
Data availability statement
The paper we comment on is available at https://doi.org/10.1080/23802359.2019.1629349. The sequence data that support the findings of this study were published previously and are openly available on GenBank at https://www.ncbi.nlm.nih.gov/nucleotide. The mitogenome of Tringa guttifer is available at https://www.ncbi.nlm.nih.gov/nuccore/MK905885.