
Figures & data
Figure 1. Photographs of the Ophioleila elegans (scale bar: 1 cm) collected from the Shkolnik Guyot in the northwest Pacific Ocean (16° 5′ 45″ N, 151° 53′ 6.34″ E; depth: 1474 m). A: aboral view; B: oral view.
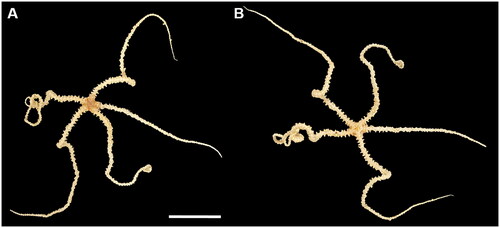
Table 1. Mitochondrial genomes belonging to the suborder Gnathophiurina and three outgroup species used for phylogenetic analysis.
Figure 2. Mitochondrial genome map of Ophioleila elegans. GC content was plotted by default values of window size (500) and score scale (1).
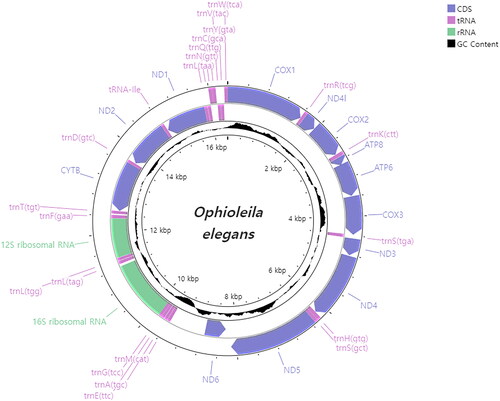
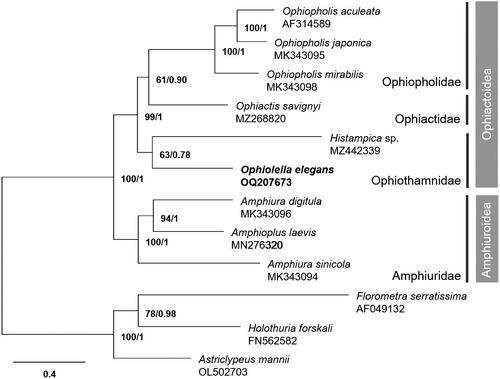
Figure 3. The maximum-likelihood (ML) phylogenetic tree of Ophioleila elegans and other ophiuroid species based on 13 protein-coding mitochondrial genes. Numbers on each node denote the bootstrap support values from the ML and the Bayesian posterior probabilities from the Bayesian inference (BI) method. The scale bar indicates the number of substitutions per site.
Supplemental Material
Download MS Word (298.2 KB)Supplemental Material
Download PNG Image (282 KB)
Data availability statement
The mitogenome sequence data that support the findings of this study are openly available in GenBank of NCBI at https://www.ncbi.nlm.nih.gov/ under the accession no. OQ207673. The associated BioProject, SRA, and Bio-Sample numbers are PRJNA943565, SRR23824997, and SAMN33731640, respectively.