
Figures & data
Figure 1. The living plant of Goodyera yunnanensis used in this study. This species has typically narrow-ovate sepals, oblong-ligulate and oblique petals. The photograph was taken by Mei-Xiang Hu in Shangri-La, Yunnan, China, and was used with the author’s permission.
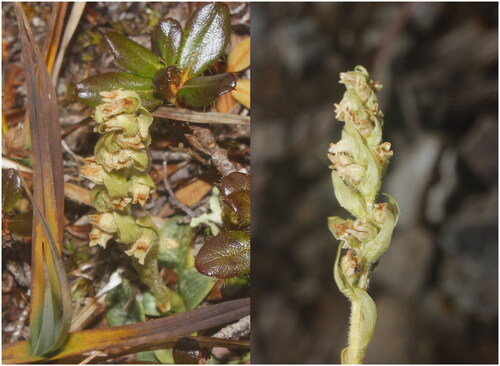
Figure 2. Gene map of the plastid genome of Goodyera yunnanensis was drawn using Organellar genome DRAW (OGDRAW). the center of the map indicates the species name and size of the plastid genome. The outer circle represents the gene, showing the direction of transcription of the gene, while the inner circle represents the size of the IRs, LSC, and SSC, respectively. Genes belonging to different functional groups have been color-coded. The darker gray area in the inner circle corresponds to GC content, and the gray line in Middle represents the 50% threshold, whereas the lighter gray corresponds to at content.
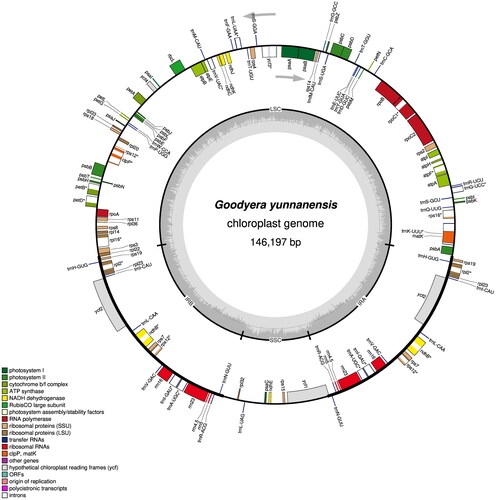
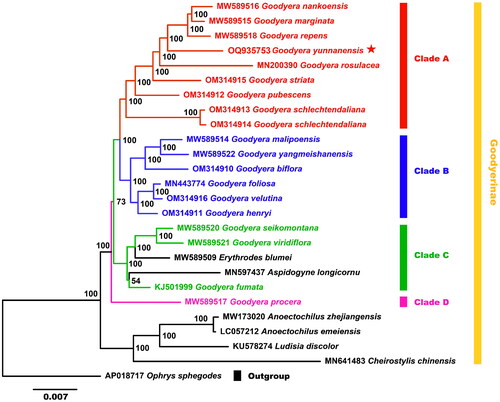
Figure 3. Phylogenetic relationships among 18 Goodyera species and other species of Goodyerinae were inferred from ML analyses under the GTRGAMMA based on the whole plastid genome, with Ophrys sphegodes as the outgroup, and the phylogenetic position of Goodyera yunnanensis (OQ935753) is marked with a red asterisk. The bootstrap support values are exhibited next to the nodes, and the Genbank accession numbers of each genome are shown in front of the latin name, respectively. The plastid genome sequences used for phylogenetic reconstruction were all referenced and derived from Kim and Kim (2002) study, as follows: Goodyera nankoensis MW589516, G. marginata MW589515, G. repens MW589518, G. rosulacea MN200390, G. striata OM314915, G. pubescens OM314912, G. schlechtendaliana OM314913/OM314914, G. malipoensis MW589514, G. yangmeishanensis MW589522, G. biflora OM314910, G. foliosa MN443774, G. velutina OM314916, G. henryi OM314911, G. seikomontana MW589520, G. viridiflora MW589521, G. fumata KJ501999, G. procera MW589517, Erythrodes blumei MW589509, Aspidogyne longicornu MN597437, anoectochilus zhejiangensis MW173020, A. emeiensis LC057212, ludisia discolor KU578274, cheirostylis chinensis MN641483, Ophrys sphegodes AP018717.
Supplemental Material
Download MS Excel (11.6 KB)Supplemental Material
Download MS Word (1.9 MB)Data availability statement
The genome sequence data that support the findings of this study are openly available in GenBank of NCBI at https://www.ncbi.nlm.nih.gov/ under the GenBank accession OQ935753. The associated BioProject, SRA and BioSample numbers are PRJNA970196, SRR24464625 and SAMN34995382, respectively.