
Figures & data
Figure 1. The morphological characteristics of P. kirghisorum. (A) Habit, (B) Inflorescence, (C) Flowers (oblong-ovate, oblong or broadly lanceolate corolla), (D) Basal leaves (pinnately parted). The photos taken by Rustam Gulomov.
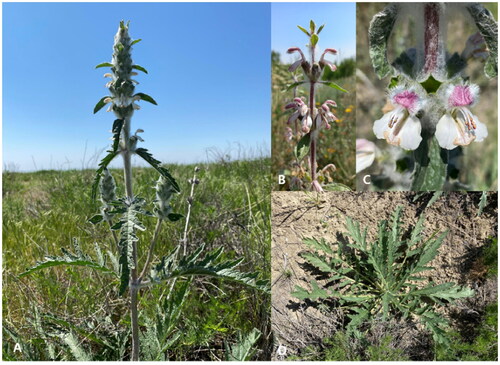
Figure 2. Chloroplast genome map of P. kirghisorum. The map contains six circles. From the center going outward, the first circle shows the distributed repeats connected with red (the forward direction) and green (the reverse direction) arcs. The next circle shows the long tandem repeats marked with short blue bars. The third circle shows the short tandem repeats (STRs) or microsatellite sequences as short bars with different colors. The fourth circle shows the size of the LSC, SSC, IRA, and IRB. The fifth circle shows the GC contents along the plastomes. The sixth circle shows the genes, and their optional codon usage bias is displayed in the parenthesis after the gene name. Genes are color-coded by their functional classification. The transcription directions for the inner and outer genes are clockwise and anticlockwise, respectively. The functional classification of the genes is shown in the bottom left corner.
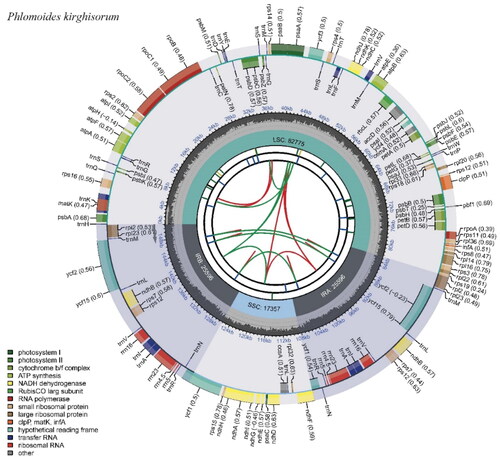
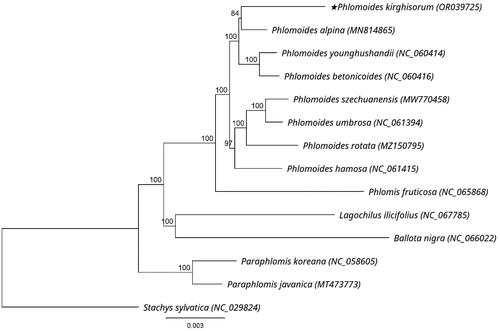
Figure 3. Phylogenetic tree of P. kirghisorum and 13 related species in Lamiaceae inferred from 80 protein-coding regions of chloroplast genomes using maximum likelihood methods. Note: the best substitution model was GTR + I + G (Akaike information criteria). Numbers in the nodes are bootstrap values with 1000 replicates. The scale bar means the expected number of nucleotide substitutions per site. The chloroplast genome of Stachys sylvatica was used as an outgroup. The following sequences were used: P. alpina MN814865 (Liu et al. Citation2020), P. younghushandii NC_060414 (Min et al. Citation2021), P. betonicoides NC_060416 (Zhao et al. Citation2019), P. szechuanensis MW770458 (unpublished), P. umbrosa NC_061394 (unpublished), P. rotata MZ150795 (Pema et al. Citation2021), P. hamosa NC_061415 (unpublished), Phlomis fruticosa NC_065868 (unpublished), Lagochilus ilicifolius NC_067785 (unpublished), Ballota nigra NC_066022 (unpublished), Paraphlomis koreana NC_058605 (unpublished), Paraphlomis javanica MT473773 (Zhao et al. Citation2021), Stachys sylvatica NC_029824 (unpublished).
Supplemental Material
Download MS Word (338.9 KB)Data availability statement
The genome sequence data that support the findings of this study are openly available in GenBank of NCBI at (https://www.ncbi.nlm.nih.gov/) under the accession no. OR039725. The associated BioProject, SRA, and Bio-Sample numbers are PRJNA807820, SRR18131954, and SAMN26001778 respectively.