
Figures & data
Figure 1. The basidiocarps of Aureoboletus raphanaceus collected from Jiangxi Province, China. The specimen is distinguished by its dry and yellowish-white pileus covered with fibrillose to tomentose squamules and radish smell. Photographed by Kuan Zhao.
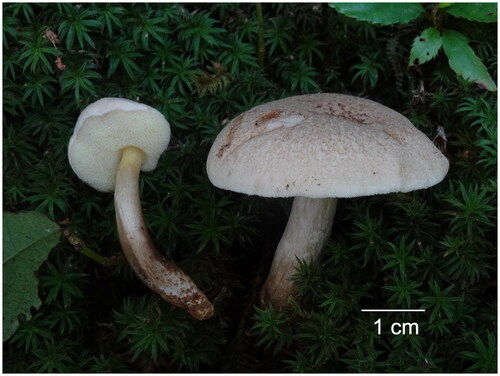
Figure 2. The mitochondrial genome map of Aureoboletus raphanaceus. Genes shown outside and inside the outer circle are transcribed in counterclockwise and clockwise directions, respectively. The inner circles represent the genome scale, GC content and distributions of short tandem repeats, long tandem repeats and the dispersed repeats, respectively. The colored parabola in the center circle represents the dispersed repeats.
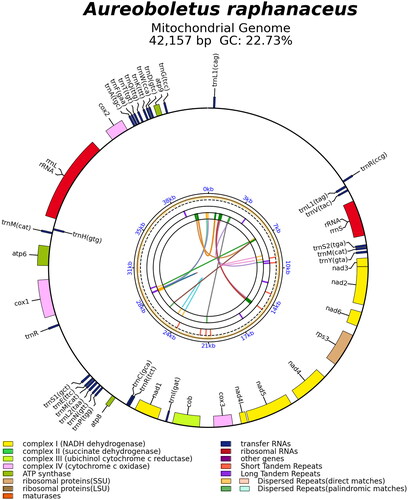
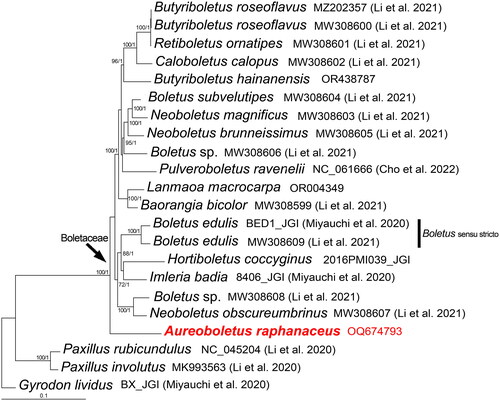
Figure 3. Phylogenetic tree of Aureoboletus raphanaceus and related taxa based on Bayesian inference (BI) and maximum-likelihood (ML) analyses of 15 core protein coding genes. The GenBank accession number from NCBI or the information of voucher specimen from JGI, along with the corresponding references (if any), are provided after the species names. The newly sequenced mitogenome is marked in red. Numbers near the nodes indicate bootstrap support values (>50%) and posterior probabilities (>0.95). The scale bar refers to 0.1 nucleotide substitutions per character.
Supplemental Material
Download TIFF Image (30.9 MB)Data availability statement
The mitochondrial genome data are available with the accession number of OQ674793 in the GenBank of NCBI (https://www.ncbi.nlm.nih.gov/). The associated Bioproject, SRA, and Biosample numbers are PRJNA923718, SRR23934031, and SAMN33841782, respectively.