
Figures & data
Figure 1. Morphology of Theobroma bicolor (KUELAP-2926). (A) Habit showing tree with branched clusters. (B) Complex leaf. (C) Immature fruits oblong-ellipsoid in shape. All images have been obtained from Oswaldo Ananco from the province of Condorcanqui, Amazonas region.
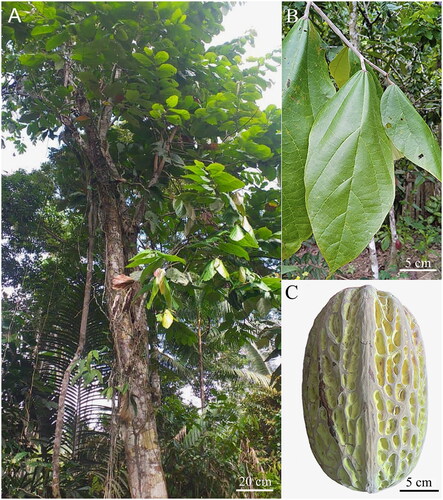
Figure 2. Schematic map of overall features of the chloroplast genome of Theobroma bicolor. The map contains six tracks in default. From the center outward, the first track shows the dispersed repeats connected with arcs. The second track shows the long tandem repeats as short bars. The third track shows the short tandem repeats or microsatellite sequences as short bars. The small single-copy (SSC), inverted repeat (IRs), and large single-copy (LSC) regions are shown on the fourth track. The GC content along the genome is plotted on the fifth track. The genes are shown on the sixth track. The optional codon usage bias is displayed in the parenthesis after the gene name. Genes are coded by their functional classification. The transcription directions for the inner and outer genes are clockwise and anticlockwise, respectively. The functional classification of the genes is shown in the bottom left corner.
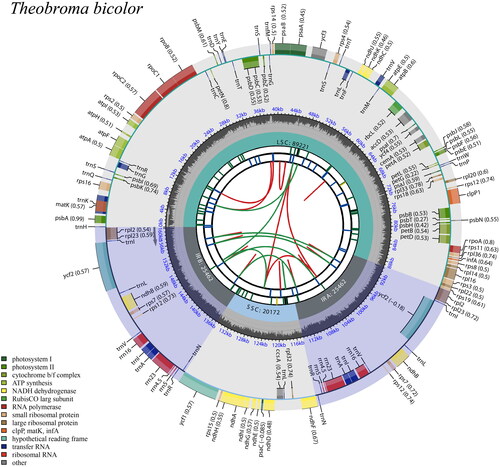
Figure 3. Maximum likelihood phylogram of Theobroma bicolor (OQ557154) and related genera. These genera are grouped in their subfamilies. For instance, the subfamiliy Grewioideae is based on the genus Grewia (Narkthai & Chantaranothai, Citation2020); whereas the subfamiliy Byttnerioideae is based on the genus Byttneria (Colli-Silva & Pirani Citation2020). Numbers along branches are RaxML bootstrap supports based on 1500 replicates. The legend below represents the scale for nucleotide substitutions.
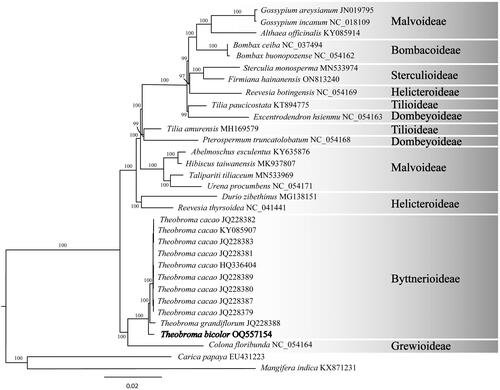
Table 1. Characteristics of plastid genome among species of T. bicolor, T. grandiflorum and T. cacao.
Supplemental Material
Download JPEG Image (853.8 KB)
Supplemental Material
Download JPEG Image (308.5 KB)
Supplemental Material
Download JPEG Image (1.4 MB)
Supplemental Material
Download JPEG Image (942 KB)
Data availability statement
The genome sequence data that support the findings of this study are openly available in GenBank of NCBI at https://www.ncbi.nlm.nih.gov/ under the accession no. OQ557154. The associated BioProject, BioSample, and SRA numbers are PRJNA944261, SAMN33745908, and SRR23852829, respectively.