
Figures & data
Figure 1. Photograph of C. hongkongensis leaf, flower, and fruit. (A) Leaf. This image was taken by Lichai Yuan at Guidong Botanical Garden, Chenzhou city, Hunan province, China. The leaf blade displays an elliptic, oblong-elliptic, or obovate-oblong shape with a thinly to thickly leathery. The leaf base is cuneate or broadly cuneate to rounded, and the apex is shortly acuminate to caudate. Typically, there are 3 or 4 (or occasionally 5) veins that ascend in a curved pattern. (B) Flower. This image was taken by Jun Liu at Hangzhou City, Zhejiang Province, China. Capitate cymes are globose, and the bracts are yellowish or white, broadly elliptic, broadly ovate, or orbicular to obovate. (C) Fruit. This image was taken by Yan Liu. The compound fruit, which is globose in shape, turns red or yellowish-red at maturity.
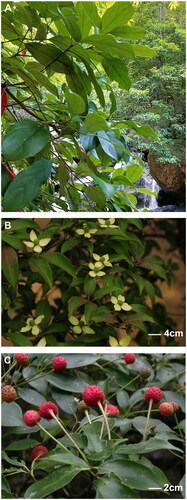
Figure 2. The complete plastome map of C. hongkongensis, which was generated by CPGview. LSC, SSC, and IRs (IRa and IRb) with their length are represented on the first circle. The second circle showed the GC ratio in dark gray. The outermost circle indicates gene name color-coded by their functional classification. The transcription directions for the inner and outer genes are clockwise and anticlockwise, respectively. The functional classification of the genes is shown in the left bottom corner. The optional codon usage bias is displayed in the parenthesis after the gene name.
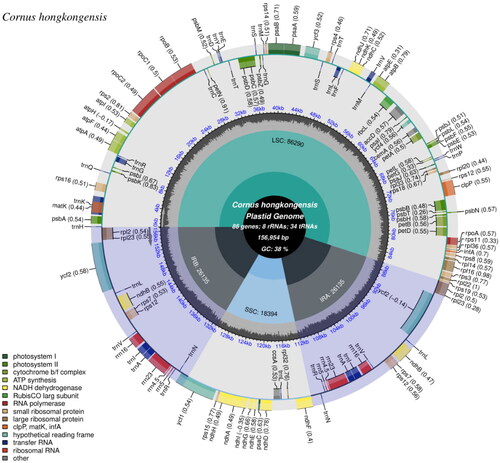
Figure 3. A maximum-likelihood (ML) based phylogenetic tree of C. hongkongensis and related Cornus species. The cladogram was shown in the lower left corner. The scale bar represents the number of nucleotide substitutions per site. The numbers on each node indicated the ML bootstrap support with 1000 replicates. The subgenus is labeled next to the species name. The bold font indicates that genus Cornus was classified into four major clades: the big-bracted (BB) group, the dwarf dogwoods (DW), the cornelian cherries (CC), and the blue- or white-fruited group (BW). The following sequences were used: Alangium alpinum (MG525003.1) (Fu et al. Citation2017), Alangium chinense subsp. strigosum (OR197702.1) (Yang et al. Citation2022), Cornus peruviana (NC_044825.1) (Fu et al. Citation2019), Cornus oblonga (NC_044811.1) (Fu et al. Citation2019), Cornus alternifolia (NC_044812.1) (Fu et al. Citation2019), Cornus controversa (NC_030260.1), Cornus wilsoniana (NC_063837.1), Cornus bretschneideri (NC_060800.1) (Li et al. Citation2020), Cornus walteri (NC_058318.1), Cornus sanguinea (NC_044817.1) (Fu et al. Citation2019), Cornus alba (NC_059720.1) (Yuan et al. Citation2021), Cornus macrophylla (NC_044810.1) (Fu et al. Citation2019), Cornus sessilis (NC_044814.1) (Fu et al. Citation2019), Cornus chinensis (NC_044815.1) (Fu et al. Citation2019), Cornus eydeana (NC_044816.1) (Fu et al. Citation2019), Cornus officinalis (NC_042746.1), Cornus suecica (NC_044823.1) (Fu et al. Citation2019), Cornus unalaschkensis (NC_044824.1) (Fu et al. Citation2019), Cornus canadensis (NC_044822.1) (Fu et al. Citation2019), Cornus disciflora (NC_044819.1) (Fu et al. Citation2019), Cornus florida (NC_044820.1) (Fu et al. Citation2019), Cornus florida var. urbiniana (MN380671.1) (Fu et al. Citation2019), Cornus sunhangii (NC_060994.1) (Lv et al. Citation2019), Cornus capitata (MG524998.1) (Fu et al. Citation2017), Cornus hongkongensis (OR545260.1), Cornus elliptica (NC_056267.1) (Lu et al. Citation2021), Cornus kousa (NC_044818.1) (Fu et al. Citation2019), Cornus hongkongensis subsp. Gigantea (OR597583.1), Cornus hongkongensis subsp. Tonkinensis (OR597581.1), Cornus hongkongensis subsp. Elegans (OR597582.1), Cornus hongkongensis subsp. Ferruginea (OR597579.1), and Cornus hongkongensis subsp. Melanotricha (OR597580.1).
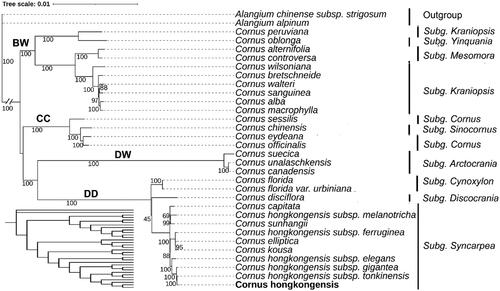
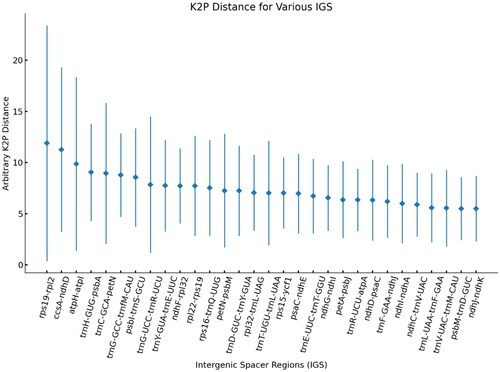
Figure 4. Results of genetic distance analysis of intergenic spacer regions in Cornus species. The top 30 IGS of K2p distances are shown. The X-axis indicates the name of IGS regions. And the Y-axis shows the range of K2p distances between different pairs of species. The diamond shows the average K2p distance.
Supplemental Material
Download MS Word (533.8 KB)Supplemental Material
Download MS Excel (202.7 KB)Data availability statement
The genome sequence data that support the findings of this study are openly available in GenBank of NCBI at https://www.ncbi.nlm.nih.gov/ under the accession number OR545260.1. The associated BioProject, BioSample, and SRA numbers are PRJNA1033361, SAMN38031310, and SRR26559992, respectively.