
Figures & data
Figure 1. Photos of Myricaria wardii. (A) The plants of M. wardii in its natural habitat; (B) The flowers of M. wardii. The species reference images were taken by Yuanyuan Chen from the sampling location in this study.
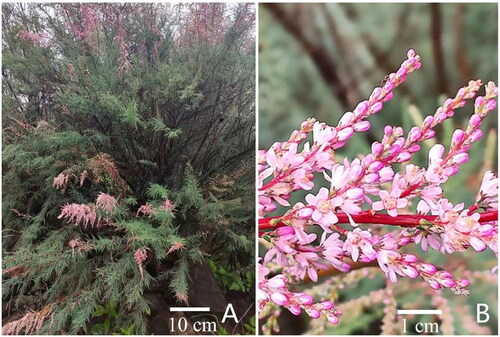
Figure 2. Gene map of the Myricaria wardii plastid genome. The map consists of six circles, each with the following information from the center outward: the circle closest to the center was indicated by red and green arcs for forward and reverse repeats, respectively. The second and third circles are indicated by short bars for tandem repeats and microsatellite sequences, respectively. The fourth circle indicates the positions of the LSC, SSC, IRA, and IRB regions, respectively. The fifth circle indicates the GC content. The outer circle indicates the function of the gene. Different colors are used to show different functional categories, as shown in the lower left of the picture.
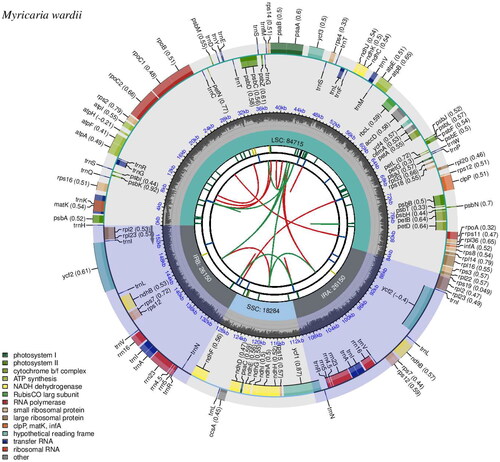
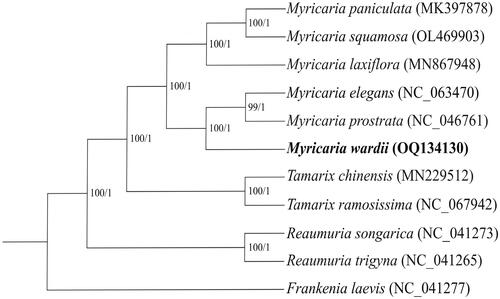
Figure 3. Maximum-likelihood (ML) and Bayesian inference (BI) phylogenetic trees based on 11 plastomes with Frankenia laevis as an outgroup. The numbers near the nodes were the bootstrap values for ML and posterior probabilities for BI tree of each clade, respectively. The following sequences were used: Myricaria paniculata MK397878, Tamarix chinensis MN229512, Tamarix ramosissima NC_067942, Reaumuria songarica NC_041273, Reaumuria trigyna NC_041265 and Frankenia laevis NC_041277 (Yao et al. Citation2019), Myricaria laxiflora MN867948 (Wang et al. Citation2020), Myricaria elegans NC_063470 (Han et al. Citation2021), Myricaria prostrata NC_046761 and Myricaria squamosa OL469903 (Chi et al. Citation2019).
Supplemental Material
Download MS Word (201.8 KB)Data availability statement
The genome sequence data that support the findings of this study are openly available in GenBank of NCBI at https://www.ncbi.nlm.nih.gov/nuccoreOQ134130.1/ under the accession no. OQ134130. The associated BioProject, SRA, and Bio-Sample numbers are PRJNA939399, SRR23653047, and SAMN33537681, respectively.