
Figures & data
Figure 1. The specimen map of H. picta. This species reference image was taken by Yao.
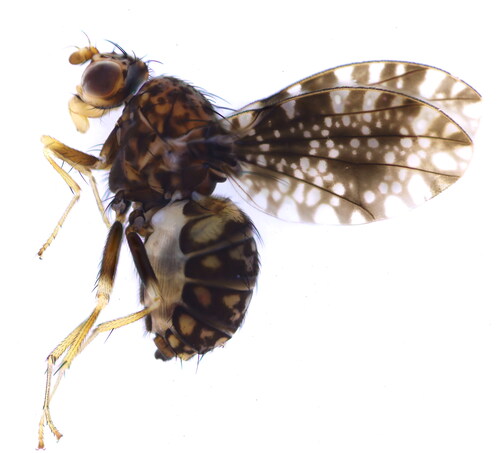
Figure 2. Mitochondrial genome map of Homoneura picta. Arrows indicate the orientation of gene transcription. Protein coding (CDS), tRNA, and rRNA genes are marked with different colors. The tRNAs are labeled according to the IUPAC-IUB single-letter amino acid codes. A GC-skew plot was created based on the deviation from the average GC-skew of the entire sequence. The GC content was plotted using a black sliding window, as the deviation from the average GC content of the entire sequence.
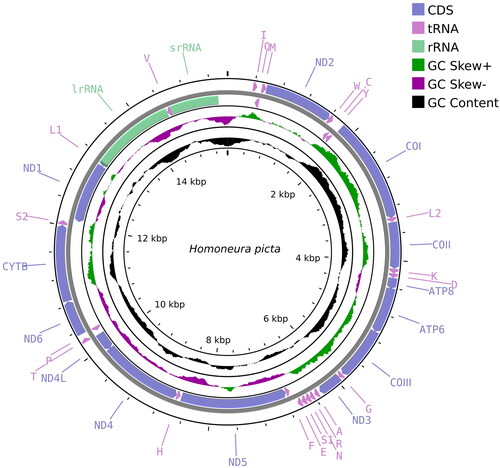
Table 1. Organization of the mitogenome of Homoneura picta.
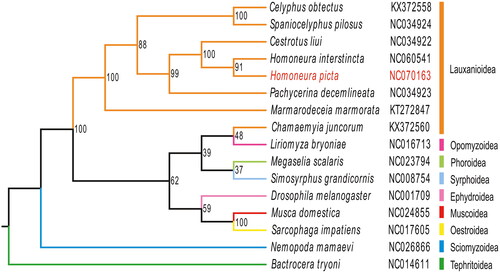
Figure 3. The phylogenetic tree was developed using the maximum-likelihood method, based on 13 PCGs and 2 ribosomal genes in the mitochondrial genome; the third locus of the mitochondrial genes was removed through nucleotide sequencing. The following sequences were used: NC060541 (unpublished), NC070163 (this study), NC034922, NC034923, KX372558, NC034924 (Li et al. Citation2017), KT272847 (Junqueira et al. Citation2016), NC014611 (Nardi et al. Citation2010), NC026866 (Li et al. Citation2015), NC001709 (Lewis et al. Citation1995), NC024855 (Li et al. Citation2016), NC017605 (Nelson et al. Citation2012), KX372560 (Li et al. Citation2017), NC023794 (Zhong et al. Citation2016), NC016713 (Yang et al. Citation2013), NC008754 (Cameron et al. Citation2007).
Supplemental Material
Download JPEG Image (223.1 KB)
Data availability statement
The genome sequence data that support the findings of this study are openly available in GenBank of NCBI at https://www.ncbi.nlm.nih.gov, reference number NC070163. The associated BioProject, SRA, and Bio-Sample numbers are PRJNA983226, SRR24922755, and SAMN35722764, respectively.