Figures & data
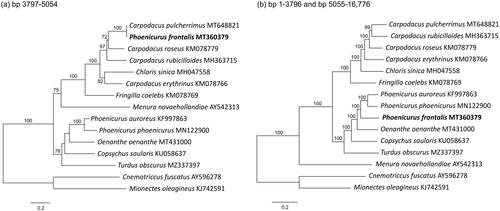
Figure 1. ML phylogenies of oscine passerines (passeriformes) based on (a) positions 3797–5054 (1258 bp) of mitogenome MT360379, (b) mitogenomes excluding positions 3797–5054. Numbers along branches represent bootstrap support values (>70%) based on 1000 pseudoreplications. Note the different position of phoenicurus frontalis (MT360379) in the two gene trees.