
Figures & data
Figure 1. Morphology and phylogenetic identification of S. alboinfundibuliformis. (A, B) Side and top view of the S. alboinfundibuliformis fruiting body. The photograph was taken by Yongjie Zhang from Mountain Taishan in Taiyuan (37°44′57″N, 112°26′26″E), Shanxi Province, China. (C) ML and BI phylogenetic tree of Singerocybe species based on the concatenated dataset of four nuclear DNA fragments, namely nrDNA ITS, nrDNA LSU, RPB2, and TEF1, with Clitocybe subditopoda, Clitocybe candicans, and Lepista irina as outgroups. Bootstrap values (BP) ≥50% from ML analysis and Bayesian posterior probabilities (PP) ≥0.80 from BI analysis are shown at internal nodes. The specimen from this study is highlighted. Among the seven known species in Singerocybe, the type species of the genus, Singerocybe viscida, has no available DNA sequence and therefore is not included in the phylogenetic analysis.
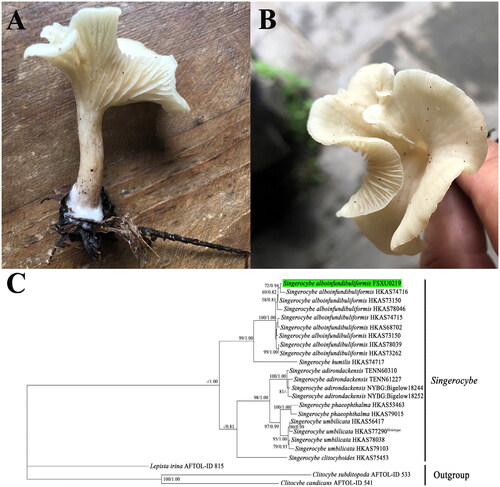
Figure 2. Circular map of the S. alboinfundibuliformis mitogenome. The outer ring marks relative positions of different genes, and the inner ring represents GC contents. Blocks outside the ring represent forward strand genes, and blocks inside the ring represent reverse strand genes. Different kinds of genes are shown in different colors. The 14 protein-coding genes typically found in fungal mitogenomes and the two rRNA genes are shown in bold. Intron-containing genes are followed by asterisks after gene names.
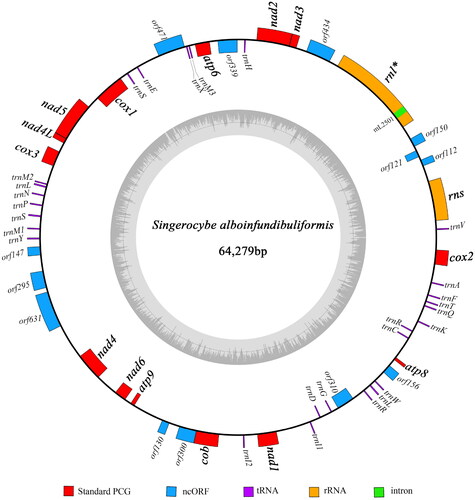
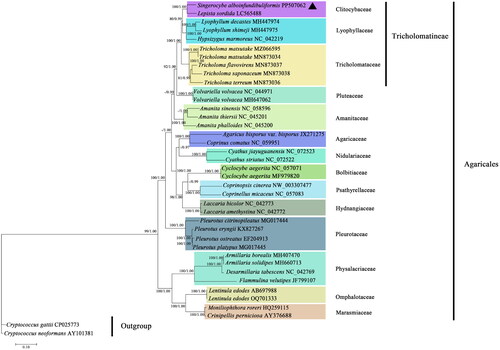
Figure 3. Phylogenetic tree constructed based on 14 core protein-coding genes. The phylogenetic tree shows the evolutionary relationships between S. alboinfundibuliformis and 36 other Agaricales species, with Cryptococcus gattii and Cryptococcus neoformans as the outgroups. The tree shown here was the single best topology recovered from ML, and the topology was identical to that recovered from BI. Support values from ML (before forward slash) and BI (after forward slash) analyses are given for nodes receiving strong supports (i.e. ML bootstrap values ≥70% or BI posterior probability ≥0.95). The sample resulting from this study is denoted in triangle.
Supplemental Material
Download MS Word (1.3 MB)Data availability statement
BioProject, BioSample, and SRA accession numbers related to the sample of this study are PRJNA1090458, SAMN40566090, and SRR28409254, respectively. The mitochondrial genome data that support the findings of this study are openly available in the Nation Center for Biotechnology Information (NCBI) at https://www.ncbi.nlm.nih.gov, with an accession number PP507062.