Figures & data
Figure 1. Construction and visualization of over/under-citation of papers based on author gender. (A) Illustration of the random draws model. Gender proportions in reference lists are compared to the overall gender proportion of the existing literature. Right panel shows the over/under-citation of different author gender groups compared to their expected proportions under the random draws model. (B) Illustration of the relevant characteristics model. Gender proportions in reference lists are compared to gender proportions of articles that are similar to those that were cited across various domains (the year of publication, the number of authors, whether the paper was a review article, the seniority of the paper’s first and last authors). Right panel shows the over/under-citation of different author gender groups compared to their expected proportions under the relevant characteristics model.
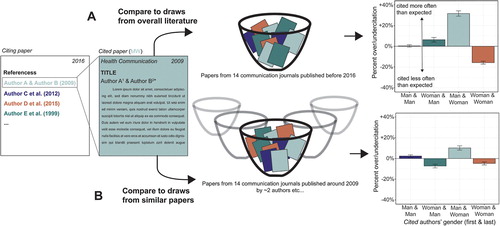
Figure 2. Associations between author gender and gendered citation practices. (A) Degree of over/under-citation of different author genders within MM (papers with man author in first and last position) reference lists (left) and within WW (papers with a woman author in first, ast, or both positions) reference lists (right). (B) Full breakdown of gendered citation behavior within W
W reference lists.
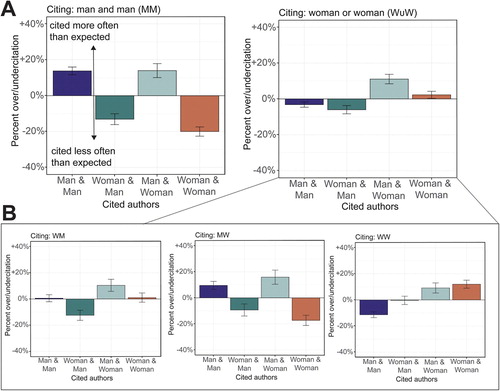
Figure 3. Visualization of co-authorship network composition measures. (A) Example of region of co-authorship network, where a specific article (edge) and the first and last authors (nodes) are highlighted. (B) Examples of the calculation of man author overrepresentation (; top) and MM paper overrepresentation (
; bottom) for the highlighted article. Here,
is the difference between the local proportion of men (purple nodes) and the overall proportion of men. The quantity
is the difference between the local proportion of MM papers (purple edges) and the overall proportion of MM papers. (C) Differences in the local network composition based on author gender. The panel shows that MM papers tend to have greater overrepresentation of men and man-led papers within their local networks and that WW papers tend to have a lesser overrepresentation of men and man-led papers within their local networks.
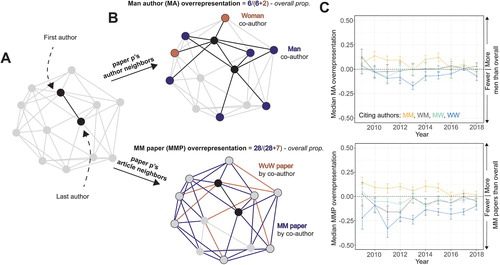
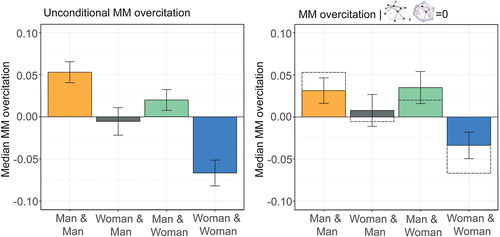
Figure 4. Article level over-citation of MM papers before and after accounting for local network composition. (A) Over-citation of MM papers by citing author gender. MM and MW papers tend to over-cite MM papers relative to expectation, WM cite MM papers at roughly the expected rate, and WW papers under-cite MM papers relative to expectation. (B) Over-citation of MM papers by author gender after accounting for network effects. Local network composition explains some of the group differences, but the general pattern remains.