
Figures & data
Figure 1. Patients included in our study. Abbreviations: mRCC, metastatic renal cell carcinoma; P/A, pembrolizumab/axitinib; TKI, tyrosine kinase inhibitor; CT, computed tomography.
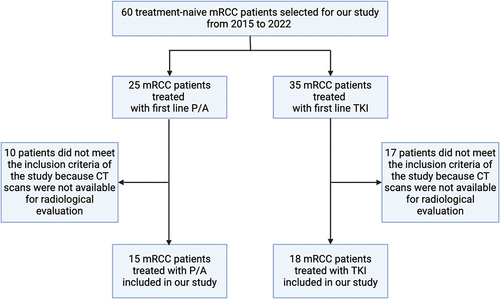
Table 1. Baseline patients’ features in both experimental (immune-based combination) and control (TKI) groups as well as in overall population, along with p-value for association between categorical or continuous variables and the two groups.
Figure 2. PFS in patients in the control group, treated with a single-agent TKI. Patients were further divided in two groups: group 1 with high velocity volume reduction (HvVR) and group 2 with lower velocity volume reduction or increase (LvVR).
Figure 3. PFS in patients in the immunotherapy group, treated with pembrolizumab plus axitinib. Patients were further divided in two groups: group 1 with high velocity volume reduction (HvVR) and group 2 with lower velocity volume reduction or increase (LvVR).
Figure 4. OS in patients in the control group, treated with a single-agent TKI. Patients were further divided in two groups: group 1 with high velocity volume reduction (HvVR) and group 2 with lower velocity volume reduction or increase (LvVR).
Figure 5. OS in patients in the immunotherapy group, treated with pembrolizumab plus axitinib. Patients were further divided in two groups: group 1 with high velocity volume reduction (HvVR) and group 2 with lower velocity volume reduction or increase (LvVR).
Table 2. Association between survival outcomes and TGR at each CT assessment from first-line therapy’s start in patients treated with immune-based combination, single-agent TKI and in the overall population.
Data availability statement
The datasets generated during and/or analyzed during the current study are available from the corresponding author on reasonable request.