Figures & data
Figure 1. Household energy demand profile for EED scenario.
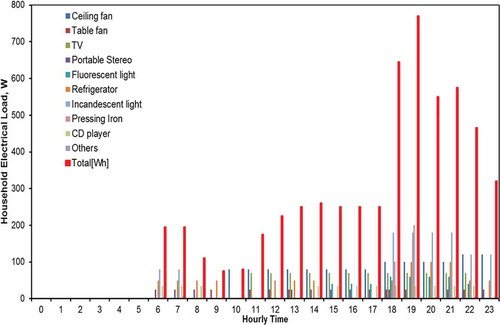
Figure 2. Household energy demand profile for FEED scenario.
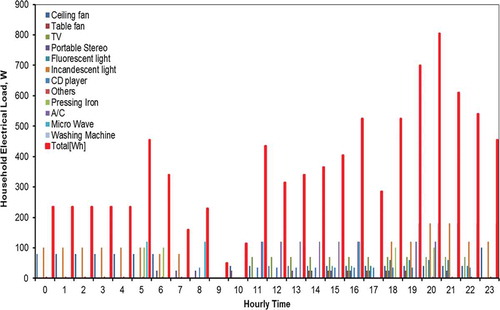
Figure 3. Average of EED and FEED energy demand.
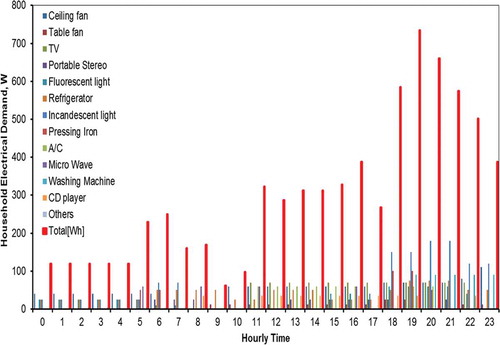
Table 1. Total energy demand.
Figure 4. Solar irradiance of selected sites in the SS zone.Citation28
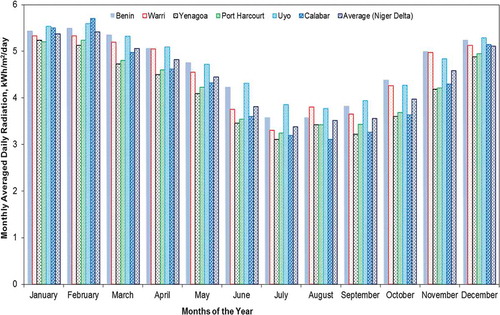
Table 2. Technical and economic specifications.
Table 3. Computed econometric data.*
Figure 5. Variation of COE with discount rate for FED in SS zone.
Figure 6. Variation of COE and initial capital with PV cost for FED in SS zone.
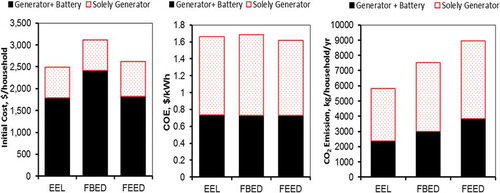
Figure 7. Economic-environmental parameters under diesel generators.