
Figures & data
Table 1. Sample size distribution along selected study sites.
Table 2. Age and household size of biogas plant adopters.
Figure 1. Marital status and education level of biogas plant adopters.
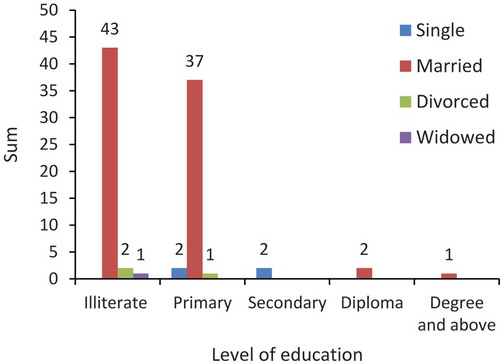
Table 3. Total number of installed biogas plants in Tigray since 2009.
Figure 2. Rate of annual biogas plant installations.
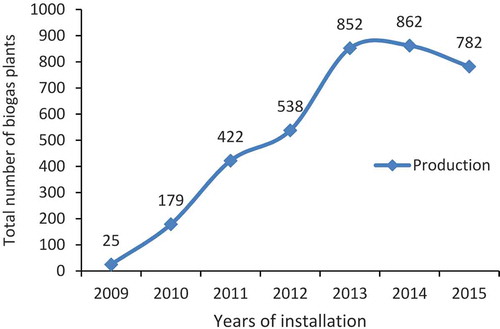
Figure 3. Number of years spent by adopters in using biogas.
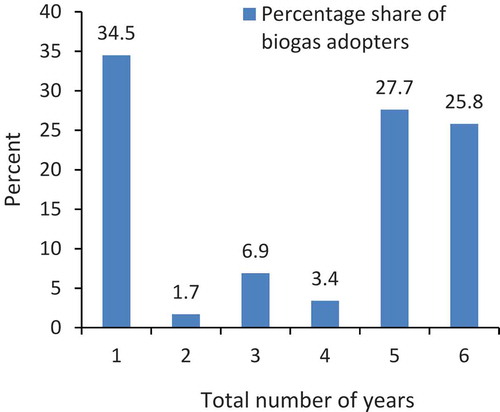
Table 4. Purpose of biogas use.
Table 5. Required inputs for biogas plant installation.
Figure 4. Institutional arrangements of biogas.
Source: adapted from National Biogas Program of Ethiopia, 2014.
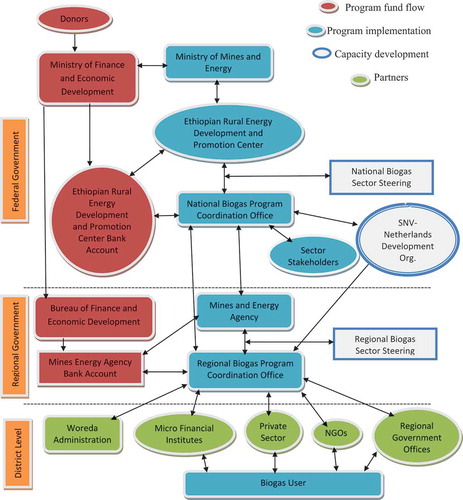
Table 6. Effectiveness of “satisfied customer telling friends” promotional approach.
Table 7. Ways of biogas promotion.
Table 8. External assistance gained by biogas adopters during construction.
Table 9. Current operational status of biogas plants.
Figure 5. Reasons for disuse of biogas plants.
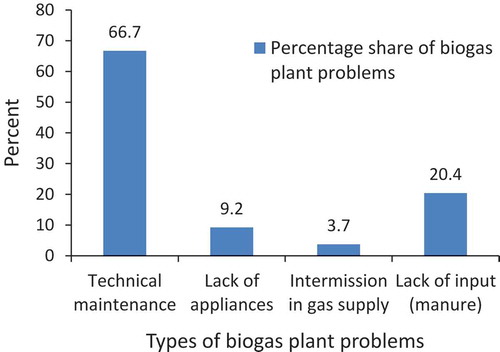
Table 10. Manure management after biogas adoption.
Table 11. Use of bio-slurry as fertilizer by biogas users.
Figure 6. Main source of energy before biogas adoption.
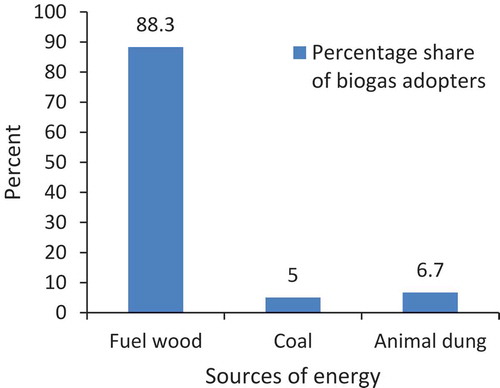
Table 12. Source of fuel wood before biogas adoption.
Table 13. Toilet connection with bio-digester.