146
Views
5
CrossRef citations to date
0
Altmetric
Articles

The role of H+/OH channels in saline pathology of Chara australis: brief history

, &
Pages 45-54 | Received 31 May 2017, Accepted 10 Jul 2017, Published online: 07 Aug 2017

Figures & data

Figure 1. pH banding: (a) white CaCO3 crystals seen in older cells (b) pH around the long internodal cell visualized with pH indicator phenol red (yellow at low pH and appearing light in the figure, pink at high pH and appearing dark in the figure).
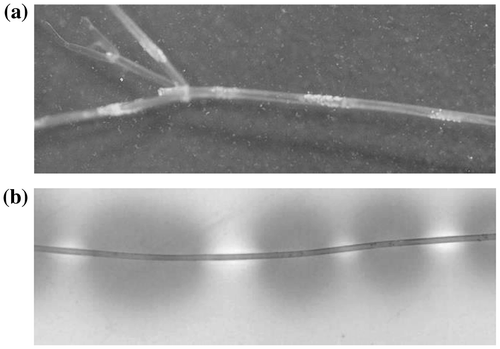
Figure 1. pH banding: (a) white CaCO3 crystals seen in older cells (b) pH around the long internodal cell visualized with pH indicator phenol red (yellow at low pH and appearing light in the figure, pink at high pH and appearing dark in the figure).

Figure 2. The H+/OH channel – dominated I/V characteristics in high pH state (green) and after exposure to saline APW at pH 7 (red) and pH 9 (blue). (a) The high pH state data were re-plotted from Figure (Al Khazaaly and Beilby Citation2012) and shows statistics from 5 cells and 12 I/V profiles at pHo 11.1. The saline APW data at pH 7 (74 min saline exposure, blue) was re-plotted from Figure (Beilby and Al Khazaaly Citation2009) and the data at pH 9 (saline exposure 119 min, red) was re-plotted from Figure (Beilby and Al Khazaaly Citation2009). The inward and outward rectifiers made a small contribution to the data fit at pH 9 (the increases in conductance near 0 and −200 mV) and the inward rectifier was included in pH 7 data fit (increase in conductance at −200 mV). The lines in (a)–(c) were generated by the GHK model (see Beilby and Al Khazaaly Citation2009 and Al Khazaaly and Beilby Citation2012 for the parameter values). (b) The main component currents: OH and the background currents (straight thin lines) were generated by the GHK model and empirical straight line, respectively (c) The total conductances. The dashed lines in (b) and (c) extrapolate the model OH current beyond the data.

Figure 2. The H+/OH− channel – dominated I/V characteristics in high pH state (green) and after exposure to saline APW at pH 7 (red) and pH 9 (blue). (a) The high pH state data were re-plotted from Figure 2 (Al Khazaaly and Beilby Citation2012) and shows statistics from 5 cells and 12 I/V profiles at pHo 11.1. The saline APW data at pH 7 (74 min saline exposure, blue) was re-plotted from Figure 2 (Beilby and Al Khazaaly Citation2009) and the data at pH 9 (saline exposure 119 min, red) was re-plotted from Figure 3 (Beilby and Al Khazaaly Citation2009). The inward and outward rectifiers made a small contribution to the data fit at pH 9 (the increases in conductance near 0 and −200 mV) and the inward rectifier was included in pH 7 data fit (increase in conductance at −200 mV). The lines in (a)–(c) were generated by the GHK model (see Beilby and Al Khazaaly Citation2009 and Al Khazaaly and Beilby Citation2012 for the parameter values). (b) The main component currents: OH− and the background currents (straight thin lines) were generated by the GHK model and empirical straight line, respectively (c) The total conductances. The dashed lines in (b) and (c) extrapolate the model OH− current beyond the data.
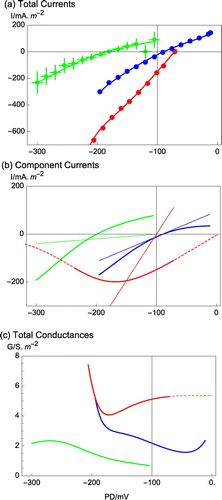
Figure 3. The saline noise: (a) At 8000 s into the experiment, the resting PD in Sorbitol APW (APW + 90 mM sorbitol) was very smooth. The two vertical lines indicate the measurement of the I/V characteristics. Introduction of Saline APW in to the cell holder at 8600 s resulted in noisy membrane PD. (b) After ~100 min exposure to Saline APW, the membrane PD depolarized and the saline noise decreased in amplitude. (c) After 173 min of Saline APW, the cell depolarized above −100 mV and the noise further decreased. (d) A sample of the early saline noise shown in greater detail (note the attached scales).
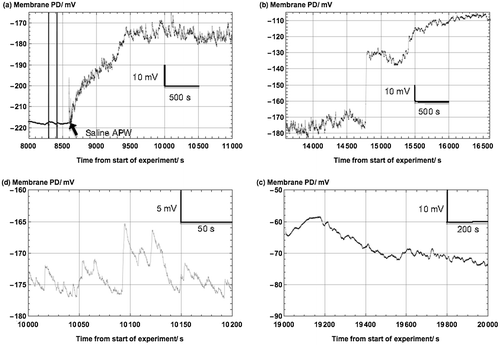
Figure 3. The saline noise: (a) At 8000 s into the experiment, the resting PD in Sorbitol APW (APW + 90 mM sorbitol) was very smooth. The two vertical lines indicate the measurement of the I/V characteristics. Introduction of Saline APW in to the cell holder at 8600 s resulted in noisy membrane PD. (b) After ~100 min exposure to Saline APW, the membrane PD depolarized and the saline noise decreased in amplitude. (c) After 173 min of Saline APW, the cell depolarized above −100 mV and the noise further decreased. (d) A sample of the early saline noise shown in greater detail (note the attached scales).

Figure 4. The change of PD-dependence of the modeled H+/OH channel as a function of pHo. (a) The hydroxide currents from Figure are re-plotted over wider PD window without the distraction of the other current elements (pHo 11: green, pHo 9 + saline: Blue, pHo 7 + saline: Red). The dashed lines indicate the GHK equation without multiplication by the the Boltzmann distribution probabilities, which increase the PD dependence (Amtmann and Sanders Citation1999; Beilby and Walker Citation1996). (b) The hydroxide conductances. Note that at high pHo the more depolarized PDs favor the closed state/s of the channels. The “closing PD” moves in depolarized direction at pHo 9. At pHo 7 the situation reverses with open state/s favored at more depolarized PDs and channels closing at more negative PDs, leading to noisy PD in hyperpolarized cells.
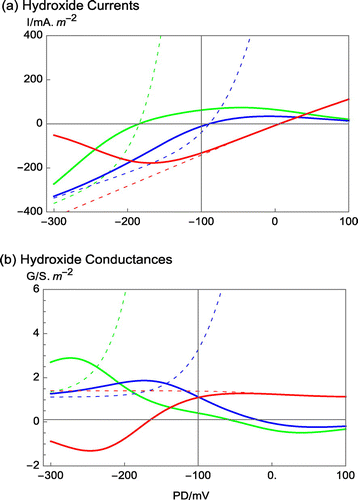
Figure 4. The change of PD-dependence of the modeled H+/OH− channel as a function of pHo. (a) The hydroxide currents from Figure 2 are re-plotted over wider PD window without the distraction of the other current elements (pHo 11: green, pHo 9 + saline: Blue, pHo 7 + saline: Red). The dashed lines indicate the GHK equation without multiplication by the the Boltzmann distribution probabilities, which increase the PD dependence (Amtmann and Sanders Citation1999; Beilby and Walker Citation1996). (b) The hydroxide conductances. Note that at high pHo the more depolarized PDs favor the closed state/s of the channels. The “closing PD” moves in depolarized direction at pHo 9. At pHo 7 the situation reverses with open state/s favored at more depolarized PDs and channels closing at more negative PDs, leading to noisy PD in hyperpolarized cells.

Figure 5. (a) and (b) Two examples of fluorescence image, visualized by FITC-dextran, and corresponding bright field image of cell regions of Chara, composed of 1410 images of a time series taken 15–45 min after the introduction of Saline APW (Bar is 200 μm) and 137 images from another cell incubated 152 min in Saline APW (Bar is 200 μm). (c) Formation of the alkaline band in APW, visualized by FITC-dextran. Bar is 250 μm.
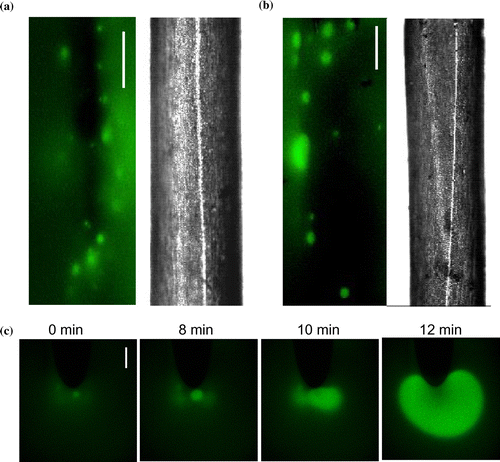
Figure 5. (a) and (b) Two examples of fluorescence image, visualized by FITC-dextran, and corresponding bright field image of cell regions of Chara, composed of 1410 images of a time series taken 15–45 min after the introduction of Saline APW (Bar is 200 μm) and 137 images from another cell incubated 152 min in Saline APW (Bar is 200 μm). (c) Formation of the alkaline band in APW, visualized by FITC-dextran. Bar is 250 μm.

Figure 6. Repetitive APs induced by mechano-stimulation in 100 NaCl/0.1 Ca2+. The cell gradually depolarized to −26 mV (presumably due to an increase of the H+/OH conductance), initiating APs with extended duration (~20 s) at intervals (26, 30, 37, 36, 33, 33 and 34 s). Replotted from Figure of Shepherd et al. (Citation2008).
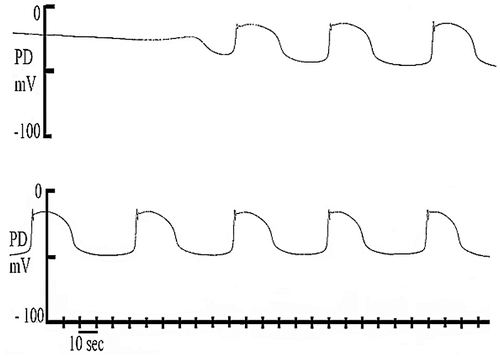
Figure 6. Repetitive APs induced by mechano-stimulation in 100 NaCl/0.1 Ca2+. The cell gradually depolarized to −26 mV (presumably due to an increase of the H+/OH− conductance), initiating APs with extended duration (~20 s) at intervals (26, 30, 37, 36, 33, 33 and 34 s). Replotted from Figure 2 of Shepherd et al. (Citation2008).

Reprints and Corporate Permissions

Please note: Selecting permissions does not provide access to the full text of the article, please see our help page How do I view content?

To request a reprint or corporate permissions for this article, please click on the relevant link below:

Academic Permissions

Please note: Selecting permissions does not provide access to the full text of the article, please see our help page How do I view content?

Obtain permissions instantly via Rightslink by clicking on the button below:

If you are unable to obtain permissions via Rightslink, please complete and submit this Permissions form. For more information, please visit our Permissions help page.