Figures & data
Figure 1. Box-whisker plot of latitudinal distributions of all Chara- and Nitella-sites included in the water chemistry dataset. Minimum, maximum and median latitude are given as well as 50% and 75% quartiles. Number of sites are given in brackets; only species with at least 5 sites are shown; genus Chara marked in grey. Please note that direction North is at low absolute numbers of latitude.
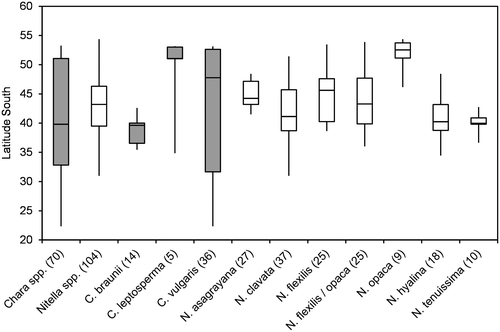
Figure 2. Box-Whisker plot of pH values for taxa with at least 3 values in the water chemistry dataset. Minimum, maximum and median pH are given as well as 50% and 75% quartiles (boxes). Number of values are given in brackets; Chara spp. marked in grey.
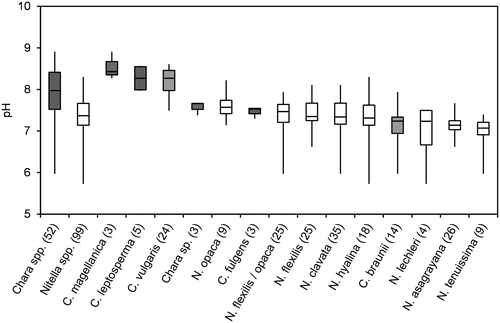
Figure 3. Box-Whisker plot of conductivity values (log scale) for all taxa with at least 3 values in the water chemistry dataset. Minimum, maximum and median values are given as well as 50% and 75% quartiles (boxes). Number of values are given in brackets; Chara spp. marked in grey.
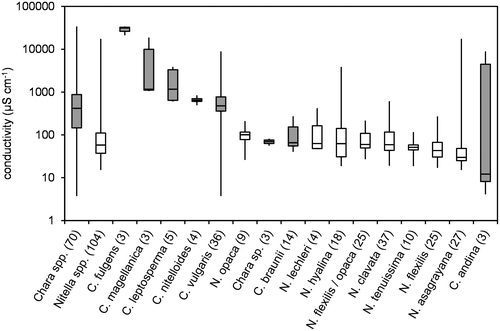
Figure 4. Box-Whisker plot of alkalinity values for all taxa with at least 3 values in the water chemistry dataset. Minimum, maximum and median values are given as well as 50% and 75% quartiles (boxes). Number of values are given in brackets; Chara spp. marked in grey.
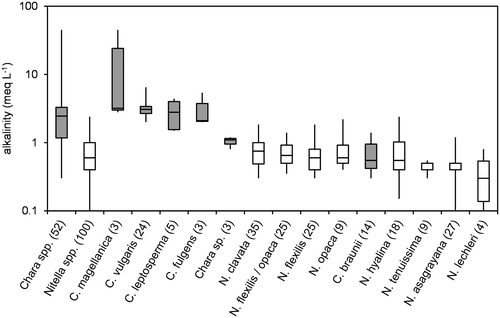
Figure 5. Box-Whisker plot of Na/K-ratios (g/g) for all taxa with at least 3 values in the water chemistry dataset. Minimum, maximum and median values are given as well as 50% and 75% quartiles (boxes). Number of values are given in brackets; Chara spp. marked in grey.
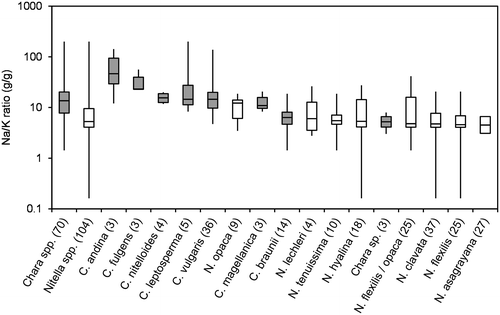
Figure 6. Box-Whisker plot of Ca/Mg-ratios (g/g) for all taxa with at least 3 values in the water chemistry dataset. Minimum, maximum and median values are given as well as 50% and 75% quartiles (boxes). Number of values are given in brackets; Chara spp. marked in grey.
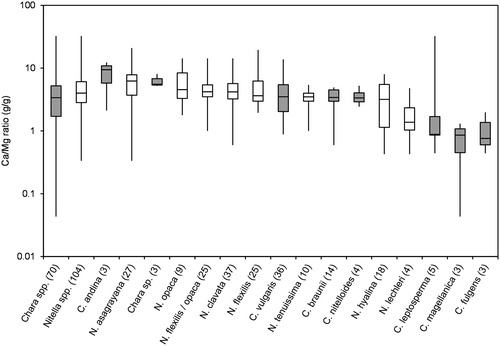
Figure 7. Box-Whisker plot of SO4/Cl-ratios (g/g) for all taxa with at least 3 values in the water chemistry dataset. Minimum, maximum and median values are given as well as 50% and 75% quartiles (boxes). Number of values are given in brackets; Chara spp. marked in grey.
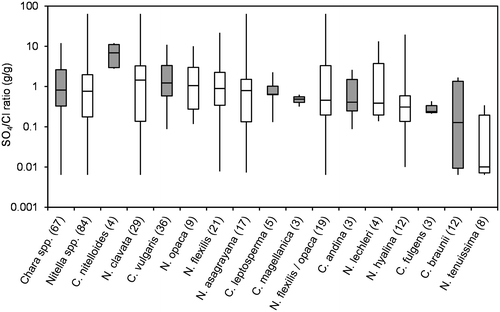
Figure 8. Multidimensional plot of water chemistry data. Upper panel: MDS plot of the full set of water chemistry data (for details see material and methods); lower panel: zoom of the central part of the MDS-plot.
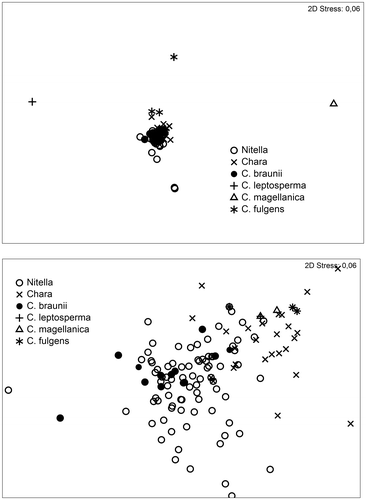
Figure 9. Principal component analysis of a subset of water chemistry data, containing only data about sites with occurrence of Chara-species. The lower panel zooms for better visibility into the centre region, where all C. braunii sites are located. For details of the PCA see Supplementary Table 1.
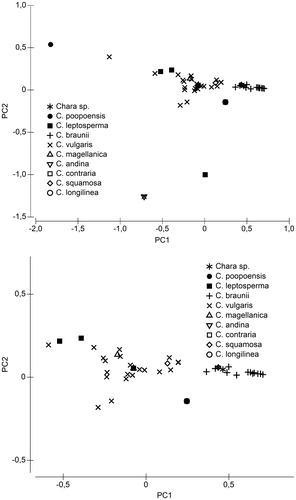
Figure 10. Principal component analysis of a subset of water chemistry data, containing only data from sites with occurrence of Nitella opaca, Nitella flexilis and sterile specimen which belong either to N. flexilis or N. opaca (N. flexilis / opaca). For details of the PCA see Supplementary Table 3.
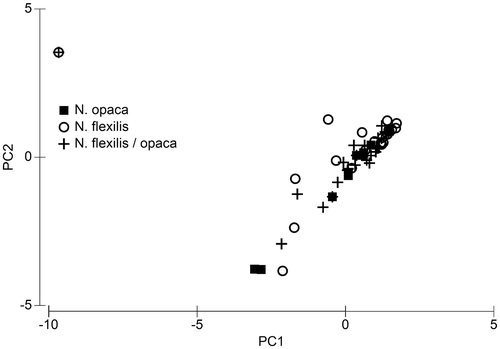
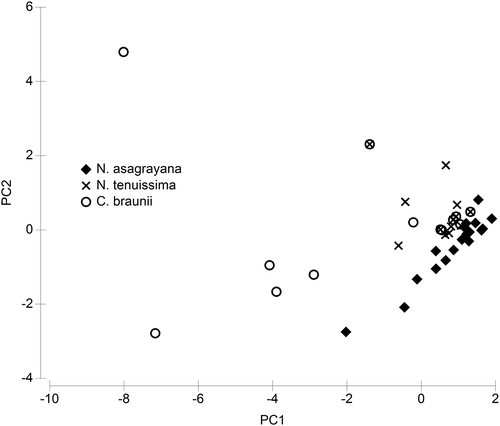
Figure 11. Principal component analysis of a subset of water chemistry data, containing only data from sites with occurrence of Nitella asagrayana, Nitella tenuissima and C. braunii. For details of the PCA see Supplementary Table 4.