
Figures & data
Figure 1. Minor vein architecture of representative specimens with low (A,B) and high vein densities (C,D). (A) Pentadesma butyracea, (B) Drypetes gilgiana, (C) Stereospermum kunthianum, (D) Ziziphus mucronata. Bar = 500 μm (all at same magnification).
Figure 2. Relationships of vein density (VLA, major VLA, minor VLA) with leaf area, and of VLA, 1° diameter, and leaf area with MAP based on PGLS.
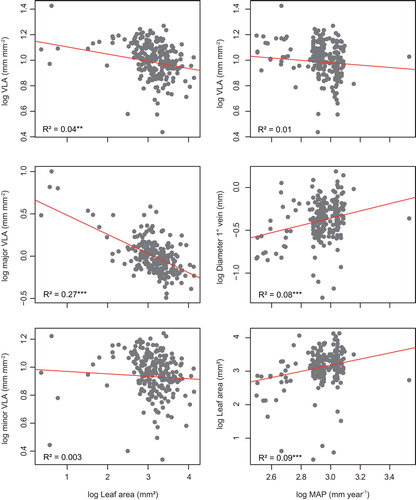
Table 1. Trait–trait and trait–climate relationships of the whole data-set. r, correlation coefficient as determined with PGLS. VLA, total vein density; LA, leaf area; Diam, diameter (of vein order 1°–3°); MAT, mean annual temperature; TS, coefficient of temperature seasonality; MAP, mean annual precipitation; PS, precipitation seasonality; p, probability; df, degree of freedom.
Table 2. Relationships between vein traits and leaf area with climatic variables, comparing the whole dataset with subsets segregated according to family or gross venation type. Values are correlation coefficients (r) as determined with PGLS. The bottom part illustrates changes in the strength of the correlations in the subsets relative to the whole data-set (“All”). +++, increase in strength (positive or negative) ≥ 0.3; ++, 0.29–0.2; +, 0.19–0.05; 0, 0.49–0 (a decrease is given in the same way but using “–” instead). Because λ has a very low power to detect phylogenetic signal in small datasets (<25 individuals; Malvaceae, craspedodromous venation), we also present correlation coefficients for scenarios with no influence of the phylogeny (i.e. λ = 0; equivalent to ordinary least squares regression) and λ = 1 (equivalent to a pure Brownian motion model). VLA, total vein density; LA, leaf area; MAT, mean annual temperature; TS, coefficient of temperature seasonality; MAP, mean annual precipitation; PS, precipitation seasonality; N, number of individuals. Here, we distinguished craspedodromous (craspedo), brochidodromous (brochido) and eucamptodromous (eucampto) venation and additionally grouped all pinnate (i.e. non-palmate) venation types.
Supplemental material