Figures & data
Figure 1. Image processing: herbarium scans as downloaded have been cropped and reduced to standard size in order to prepare them for treatment in deep learning algorithms.
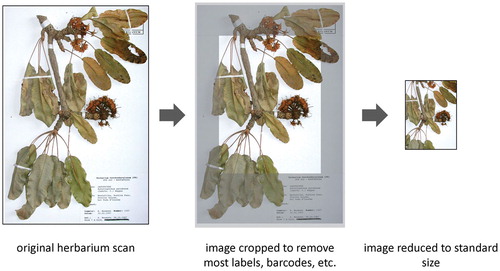
Table 1. Sequence of layers in the ResNet and dimensions of features for each layer. Since the images for herbarium scans are resized to dimensions of 196 by 292, the last average pooling layer had to be modified to cater for the change in image size.
Figure 2. A bottleneck ResNet block.
Figure 3. Species recognition from herbarium scans: performance measures depending on number of herbarium images (the frequency class includes all species with a number of images between × and ×+500): (a) boxplots of accuracy depending on number of test images per species . While the best-recognized species in each frequency class all have values > 0.9, median values increase slightly, but especially minimum values increase strongly with number of images. (b) boxplots of probability values for scans to be assigned to the correct taxon (mean probability of all test images of a taxon).
Table 2. Leaf traits used in this study with OBO ID and number of herbarium scans labelled to have this trait. The last column shows the accuracy of predicted scans for each trait.
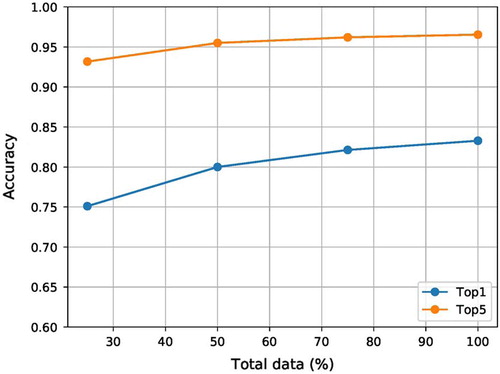
Figure 4. Accuracy of species recognition depending on the number of images available for training (25%, 50%, 75%, 100%).