
Figures & data
Table 1. Sampling localities. All sampling from naturalized populations (species: 1. H. decurrens; 2. H. drupacea; 3. H. gibbosa; 4. H. lissosperma; 5. H. salicifolia; 6. H. sericea).
Table 2. Herbarium collections, yielding good quality DNA, from the native range or annotated by Barker at Naturalis Leiden (L) for verification and additional specimens from the Allan herbarium (CHR) for New Zealand.
Table 3. Primers used in this study.
Figure 1. Flower and fruit of Hakea decurrens, H. sericea and H. gibbosa.
Table 4. Measurement of flower (10 per specimen) and fruit of Hakea decurrens, H. sericea and H. gibbosa.
Figure 2. Detail of phylogenetic tree based on concatenated matK, rbcL and trnH-psbA barcode sequences of 45 Hakea sericea specimens. A 2,425 (including gaps) alignment of 96 Hakea spp. specimens was used to construct the dendrogram with FastTree using a Jukes-Cantor substitution model and optimization of the Gamma20 likelihood. Fast global bootstrap values are shown on the internal nodes and H. drupacea (taxon level) was used to root the (taxon level) sequences. Origin of the sampled specimens is indicated with vertical bars. The full tree containing 96 Hakea spp. Is shown in S-Fig. 1.
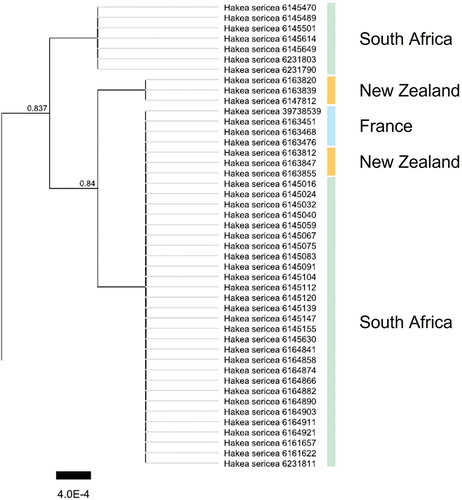
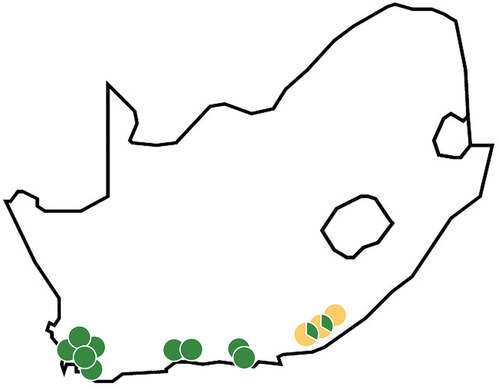
Figure 3. Map of South Africa illustrating the distribution of the two haplotypes of Hakea sericea.
Supplemental Material
Download TIFF Image (332.1 KB)Data availability statement
The annotated DNA sequences will be made available on NCBI GenBank and on EPPO Q-bank (//qbank.eppo.int/plants/). A complete list of Herbarium vouchers analysed (including NCBI codes) is included in Appendix 1.