
Figures & data
Table 1. Delineation of events, action, and discourse
Table 2. Frequency and kind of environmental and racial events: 20 January 2017 to 20 January 2018
Figure 1. All actions during the first year of Trump’s presidency (N = 256) broken into environmental and racial arenas.
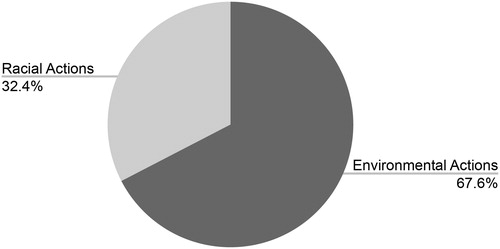
Figure 2. All discursive events during the first year of Trump’s presidency (N = 293) broken into environmental and racial arenas.
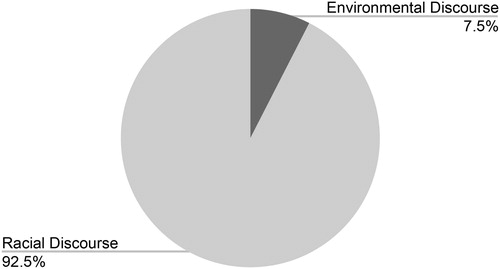
Table 3. Mechanisms for environmental events: 20 January 2017 to 20 January 2018
Table 4. Justifications for environmental events: 20 January 2017 to 20 January 2018
Figure 3. All racial tweets during the first year of Trump’s presidency (N = 355) broken down by racial group.
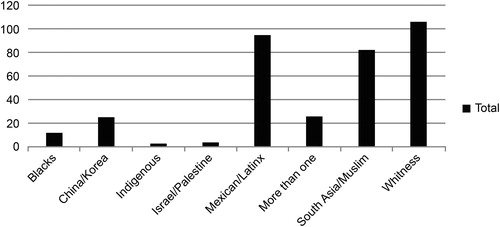
Table 5. Number of discursive events by group: 20 January 2017 to 20 January 2018