
Figures & data
Figure 1 (A) Community definitions based on UK population census small area statistics for 2011. Areas defined based on greater than 65 percent Catholic or Protestant. (B) Adjusted community definition accounting for street layout, presence of peace walls, and known community boundaries.
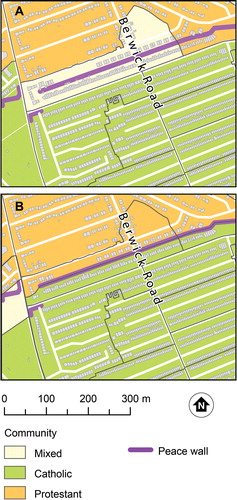
Figure 2 The T-community concept: (A) distinguish main roads from tertiary streets, (B) identify intersections between tertiary streets and main roads (or other barriers), (C) group tertiary streets into T-communities, terminating the T-community when it reaches an intersection with a main road.
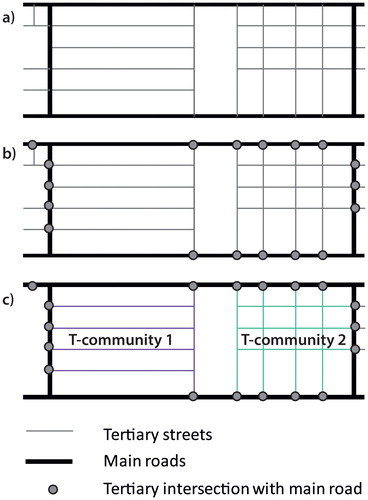
Figure 3 Summary of steps in the methodology.
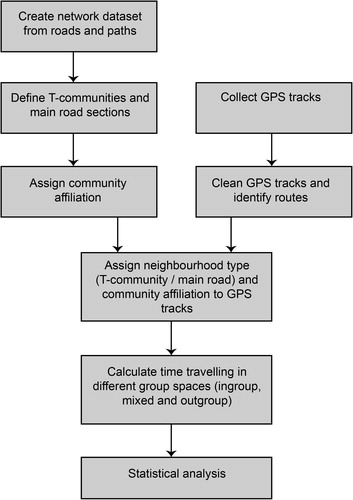
Figure 4 Study area: Catholic and Protestant communities within the study area of north Belfast, defined as census small areas with greater than 65 percent of residents identifying with this community during the 2011 Census of Population and where strong community identity is known to exist. Large nonresidential spaces and mixed neighborhoods are shown in white.
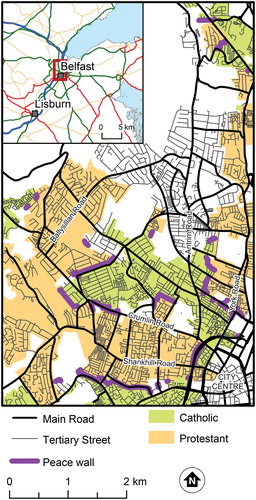
Figure 5 (A) Aerial image showing the division of the tertiary street, Berwick Road, by a peace wall. (B) Photo highlighting the impact of the barrier, on the Catholic side of the peace wall with evidence of painted murals. (C) Photo highlighting the impact of the barrier, on the Protestant side of the peace wall.
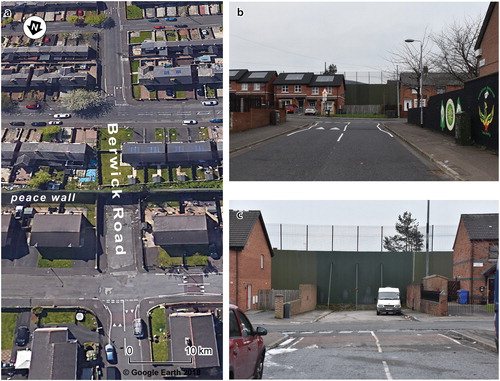
Figure 6 An illustrative section of north Belfast showing (A) defined T-communities (labeled T1–T11) and (B) sections of main roads.
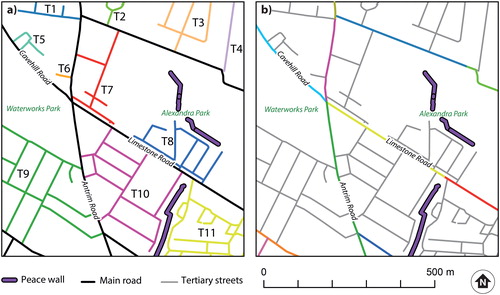
Figure 7 Median minutes spent along main roads or within T-communities, across types of group space. Note: The confidence intervals were estimated by bootstrap (1,000 replications).
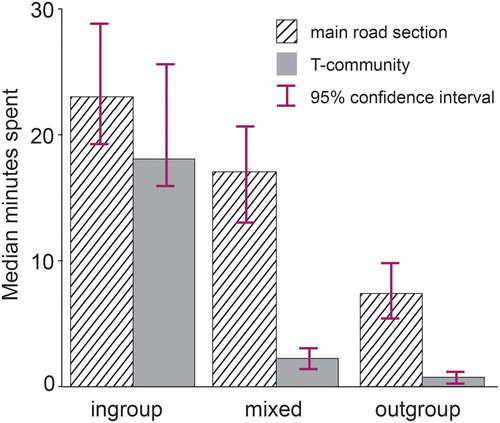
Table 1. Analysis of variance table for mixed linear model containing two-way interaction of group space and neighborhood type, controlling for home location
Figure 8 Movements captured from participants’ Global Positioning System tracks within north Belfast. Shading ranges from blue (track points show participants moving within in-group areas) to red (track points show participant movement within out-group spaces). Blended colors show mixed patterns of movement within in-group and out-group areas.
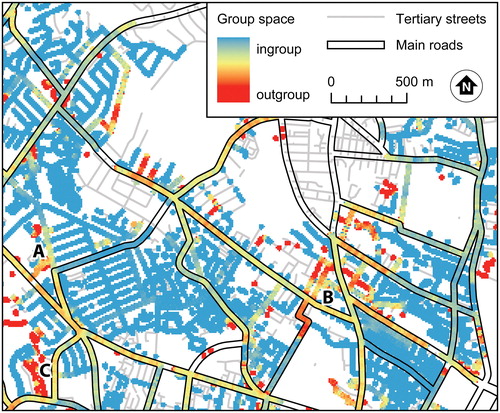
Table 2. Model coefficients (fixed effects, with bootstrapped 95 percent confidence intervals, 1,000 repetitions)
Figure 9 Median minutes spent in different group spaces by transport mode. Letters above bars indicate significantly different post hoc contrasts (Tukey). Different letters indicate a significant difference at p < 0.05. Thus, in the far right panel, a > b > c = c, indicating that participants spent significantly more time in out-group main road sections when in a vehicle than when walking in such sections or either walking or driving in T-communities.
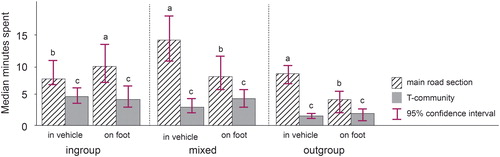
Table 3. Analysis of variance table for mixed linear modeling of time spent within in-group spaces by travel mode, community, and neighborhood type
Table 4. Model coefficients (fixed effects, with bootstrapped 95 percent confidence intervals, 1,000 repetitions)
Table 5. Analysis of variance table for mixed linear modeling of time spent in in-group spaces by gender, neighborhood type, and group space