Figures & data
Figure 1 Study site locations, flood and drought in Cambodia (Source: Open Development Cambodia) and Prey Veng province (inset; Source: European Space Agency Citation2019).
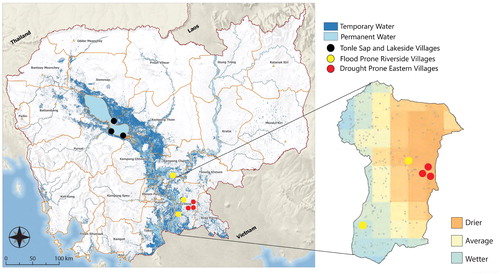
Table 1. Perception of climate change indicators disaggregated by agro-ecological zone
Figure 2 Drought perception at the provincial, commune, and village scales. Each dot represents a respondent household. Green dots are those reporting changes in drought. Red dots are those reporting no change.
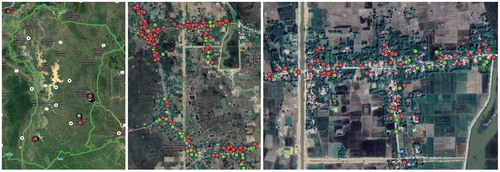
Figure 3 Spatially mapped drought and rainfall perception in an alluvial riverside village.
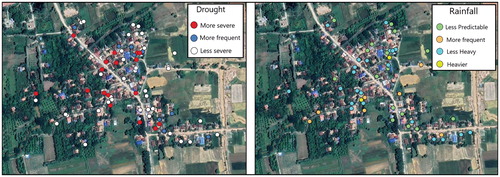
Table 2. Climate perception of fishers and nonfishers
Table 3. Climate perception of farmers and nonfarmers
Table 4. Type of change in rainfall among farmers and nonfarmers
Table 5. Migrants and migration rates disaggregated by location
Table 6. Climate perception and household migration incidence
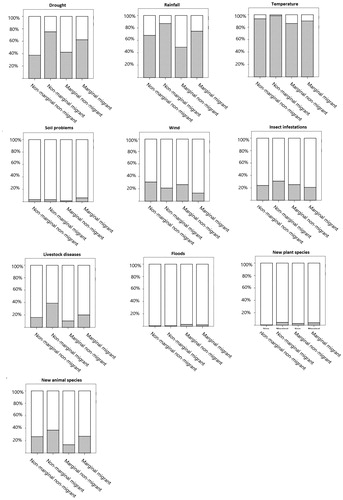
Figure 4 Climate perception and migration among marginal and nonmarginal households.