Figures & data
Figure 1 Stylized map of the Storglaciären in North Sweden in 1910 with no timescale. Source: Bolin Center for Climate Research, Swedish Glaciers (https://bolin.su.se/data/svenskaglaciarer/glacier.php?g=69). Map based on a photograph by Fredrik Enquist (1910).
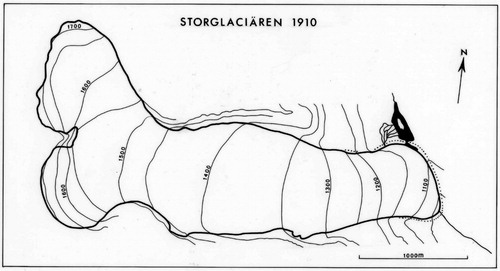
Figure 2 Representation of the 1966 Camp Century ice core with a 100,000-year timescale. Source: Dansgaard and Johnsen (Citation1969, 221) (Published with permission by International Glaciological Society, Cambridge, UK.).
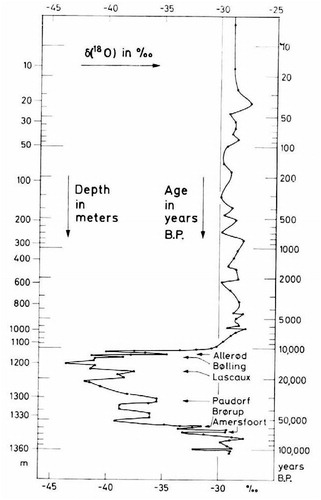
Figure 3 Pollen diagram from southern England with a 15,000-year timescale. Source: Davis (Citation1969, 325) (Published with permission by American Scientist.).
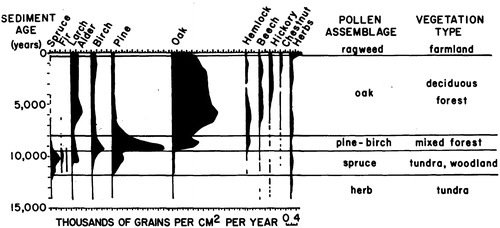
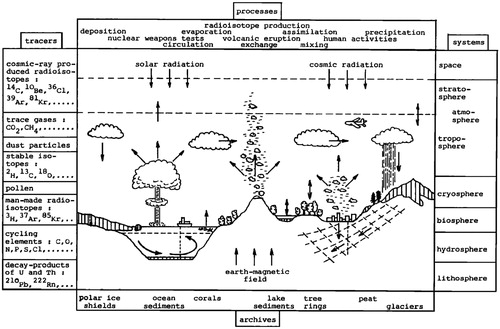
Figure 4 Diagram of the environmental system concept with multiple stylized temporal dimensions. Source: Oeschger (Citation1985) (Published with permission by the American Geophysical Union.).