Figures & data
Figure 1 Conceptual framework of integrating the who, what, and where.
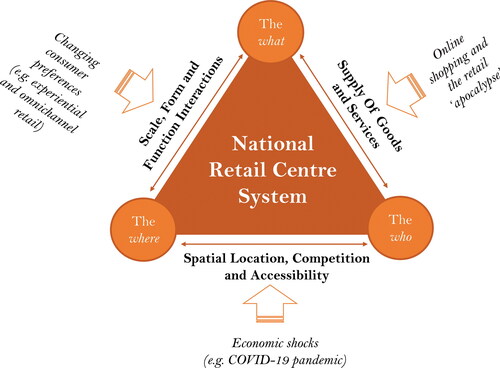
Table 1. Data set usage within each of the three components
Figure 2 Approach to retail center delineation.
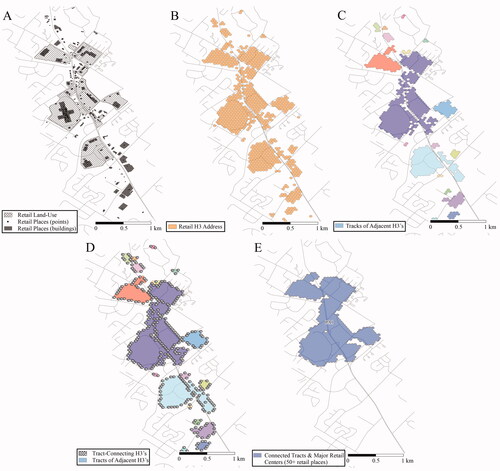
Figure 3 Use of K-rings to identify tract-connecting H3’s and build connected tracts.
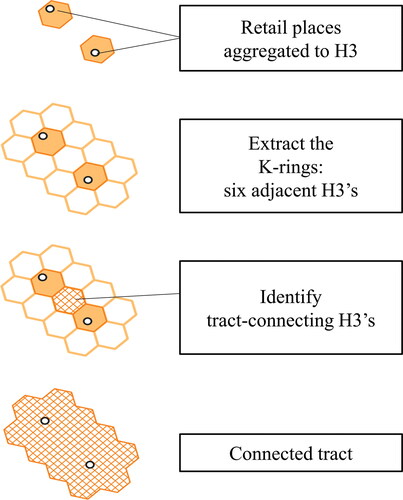
Figure 4 Distribution of U.S. retail centers (map not to scale).
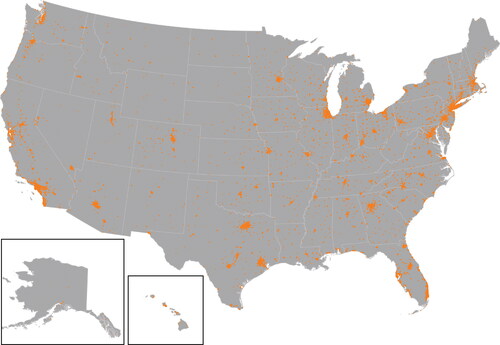
Figure 5 The where of U.S. retail centers in four contrasting urban and retail environments (maps not to scale).
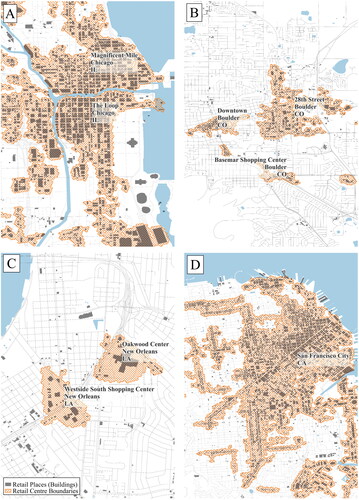
Table 2. Variables used in construction of the retail center typology
Figure 6 Determining the optimal k value for retail center groups. Value in bold represents optimal k value.
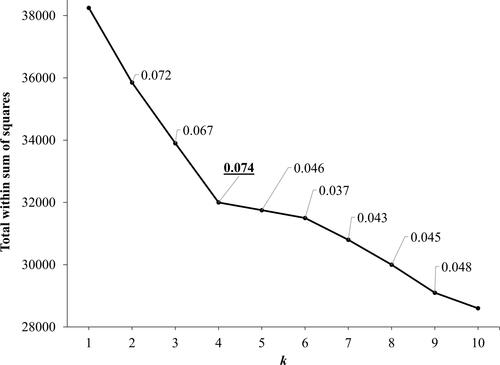
Figure 7 Pen portraits for the retail center groups.
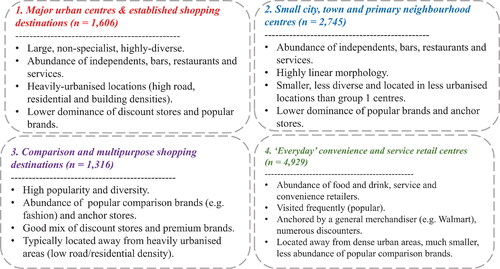
Figure 8 Distribution of U.S. retail center groups (map not to scale).
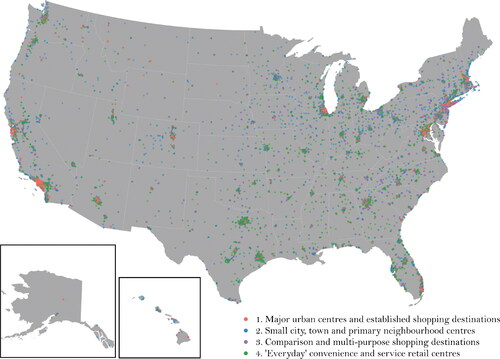
Table 3. Characteristics of the U.S. retail center types
Table 4. The observed relationship between U.S. retail center scale and function
Figure 9 Comparing the (A) observed and (B) predicted patronage probabilities for Downtown Boulder (maps not to scale).
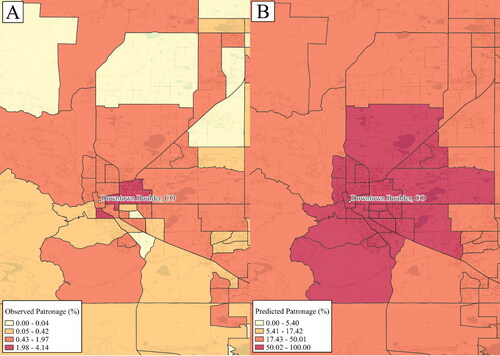
Table 5. Correlation testing of observed probabilities against predicted probabilities from Huff models with different α and β values
Figure 10 Primary catchment for Downtown Boulder, where the Huff model (A) has and (B) has not accounted for retail center type.
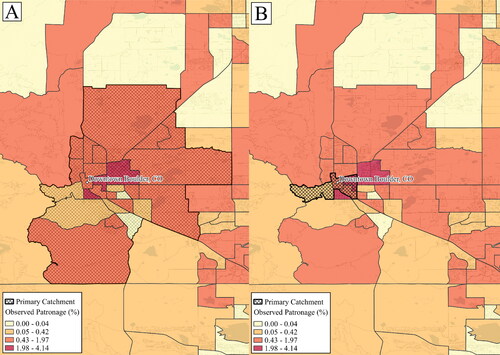
Table 6. Calibrate Huff model parameters for each retail center type.
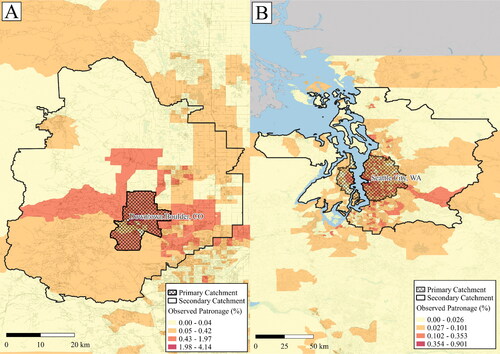
Figure 11 Primary and second catchments for the (A) Downtown Boulder and (B) Seattle City retail centers.