Figures & data
Figure 1 The traditional UK academic career path with the percentage of females at each stage of the UK pipeline (HESA Citation2021a, 2022).
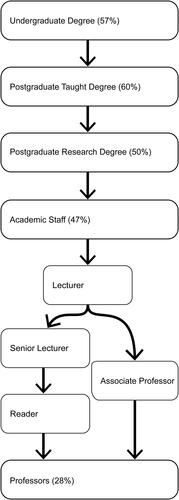
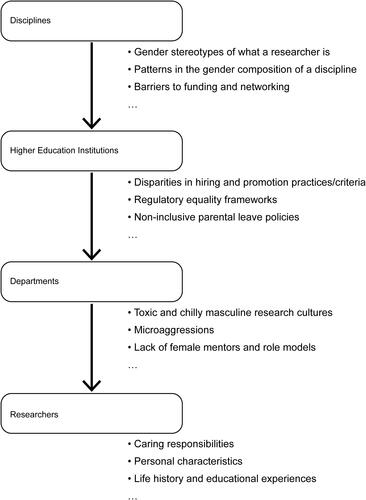
Figure 2 The multiple scales—discipline, institution, department, and researcher—of exclusionary processes within higher education.