Figures & data
Table 1. 2018 National Assessment of Education Progress (NAEP) Geography descriptive statistics for all student-level (Level 1) predictors
Table 2. 2018 National Assessment of Educational Progress (NAEP) Geography descriptive statistics for all dichotomous Level 2 predictors derived from the teacher questionnaire
Table 3. 2018 National Assessment of Educational Progress (NAEP) Geography descriptive statistics for ordinal and continuous Level 2 predictors derived from the teacher questionnaire
Table 4. 2018 National Assessment of Educational Progress (NAEP) Geography descriptive statistics for all Level 2 predictors derived from the school questionnaire and Education Demographic and Geographic Estimates (EDGE) school neighborhood income-to-poverty ratio (IPR) estimates data file
Figure 1 Baseline model (A) Level 1 and (B) Level 2 predictors of geography achievement in the United States, 2018, based on an analytic sample size of 650 schools, 1,560 teachers, and 10,830 students. Note: Effect sizes are conditional on all retained Level 1 and 2 predictors. ELL = English language learner; IEP = individualized education plan; FRLE = free and reduced-price lunch eligibility. *p < 0.05. **p < 0.01. ***p < 0.001. Source: U.S. Department of Education, National Center for Education Statistics, National Assessment of Educational Progress (NAEP) Geography, 2018.
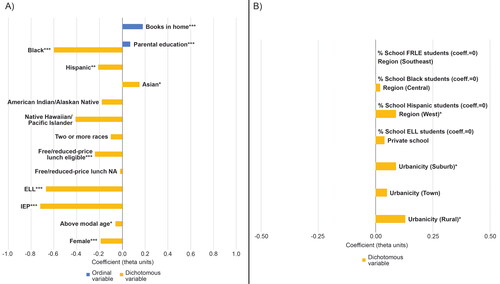
Table 5. Specifications for retained National Assessment of Educational Progress (NAEP) Geography predictor variables, 2018
Table 6. Specifications for National Assessment of Educational Progress (NAEP) Geography Level 1 opportunity to learn (OTL) predictor variables (statistically significant only), 2018
Table 7. Specifications for National Assessment of Educational Progress (NAEP) Geography Level 2 opportunity to learn (OTL) predictor variables (statistically significant only), 2018
Figure 2 Expanded model (A) Level 1 and (B) Level 2 predictors of geography achievement in the United States, 2018, based on analytic sample size of 340 schools, 980 teachers, and 6,620 students. Note: Effect sizes are conditional on all retained and newly added Level 1 and 2 predictors. Newly added predictor variables appear above the dashed line. FRLE = free and reduced-price lunch eligibility; ELL = English language learner; IEP = individualized education plan; IPR = income-to-poverty ratio. *p < 0.05. **p < 0.01. ***p < 0.001. Source: U.S. Department of Education, National Center for Education Statistics, National Assessment of Educational Progress (NAEP) Geography, 2018.
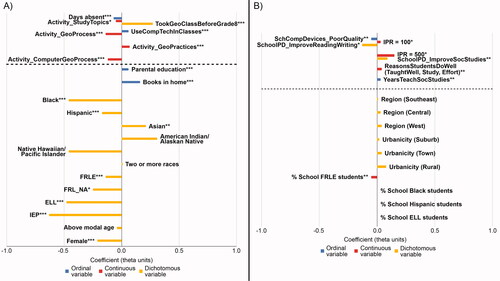
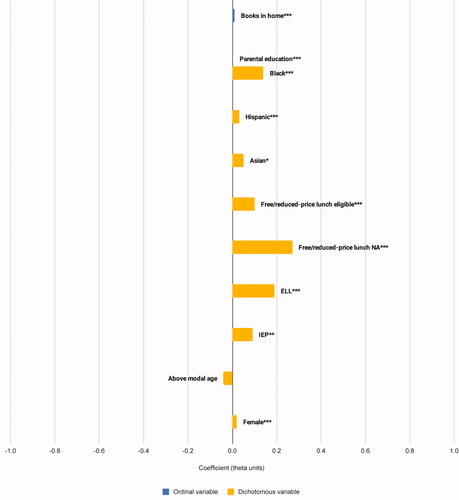
Figure 3 Net change in student-level effects after controlling for OTL and school neighborhood poverty. Note: ELL = English language learner; IEP = individualized education plan. *p < 0.05. **p < 0.01. ***p < 0.001. Source: U.S. Department of Education, National Center for Education Statistics, National Assessment of Educational Progress (NAEP) Geography, 2018.