Figures & data
Figure 1. Hierarchy of information. Disinformation is a type of misinformation. Both disinformation and misinformation are types of information. Based on graphics by Brennen, Simon, and Nielsen (Citation2021).
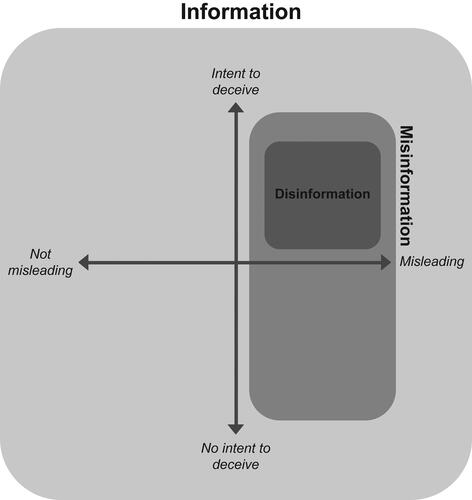
Table 1. List of media sources and date range of articles we were able to find given limitations of site-specific search engines and the challenge of searching for articles containing maps
Figure 2. Tweet of NASA map included in Breitbart article (Delingpole Citation2019).
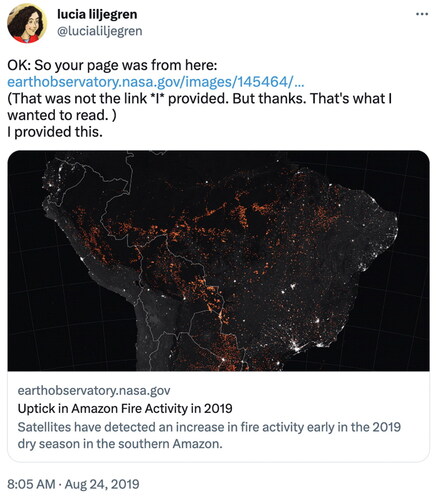
Figure 3. President Trump’s famous “Sharpie-gate” map where it appears that he used a black Sharpie marker to extend the cone of uncertainty to include Alabama to avoid contradicting his earlier tweet, which included the state in the potential danger zone (Stewart Citation2019).
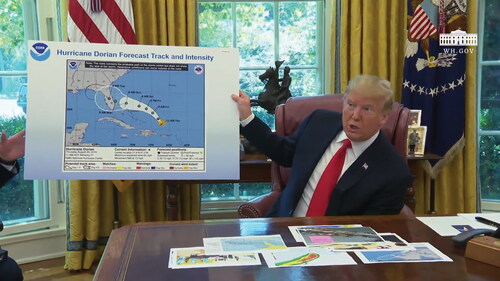
Figure 4. Map of wildfire hot spots in Australia in early 2020 overlaid on a polygon of North America. The map is confusing because it implies that the fires account for a large portion of land area by using large points to locate fires and conflating them with the areas of the two countries (Zarrell Citation2020).
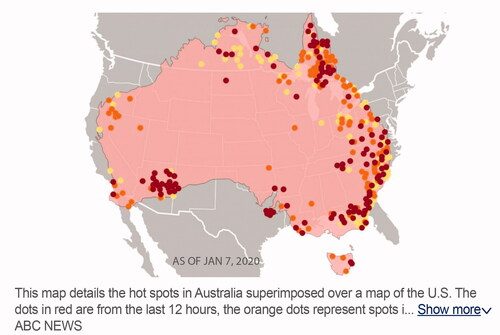
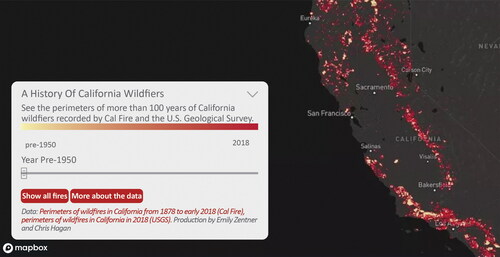
Figure 5. Map of historic wildfire perimeters in California from 1878 to 2018 (“A history of California wildfires” n.d.).