Figures & data
Figure 1. Comparison of overall activity space and localized view of activity space. Although the overall activity space of Tourist 1 and Tourist 2 look similar (left), a localized view reveals the subcomponents in their activity spaces that exhibit different spatial extent and interrelationships (right).
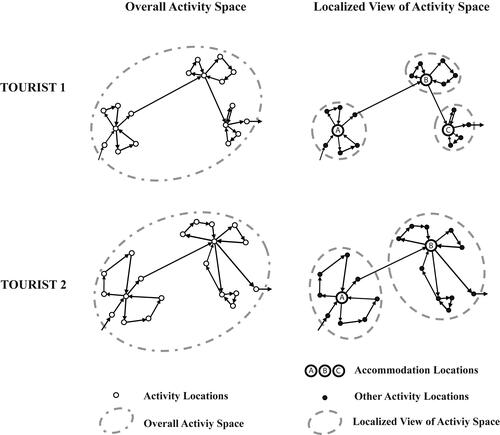
Table 1. An example of an individual’s records in the mobile phone data set
Figure 2. Illustration of key concepts of the proposed activity space representation taking a traveler in Jeju Island, South Korea, as an example.
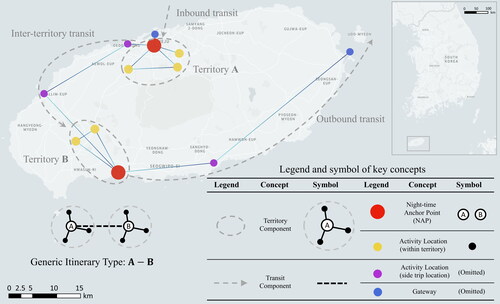
Figure 3. The distribution of stay duration: (A) The overall distribution of stay duration of all travelers. (B) The distribution of the stay duration of generic itinerary types. Note: NAP = nighttime anchor point.
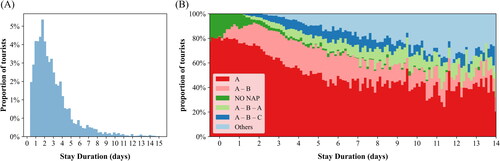
Table 2. The distribution and stay duration of generic itinerary types observed from the 111,645 travelers
Figure 4. Distribution of time ratio at the nighttime anchor point (NAP) to the territory: hub-and-spoke territory versus resort territory.
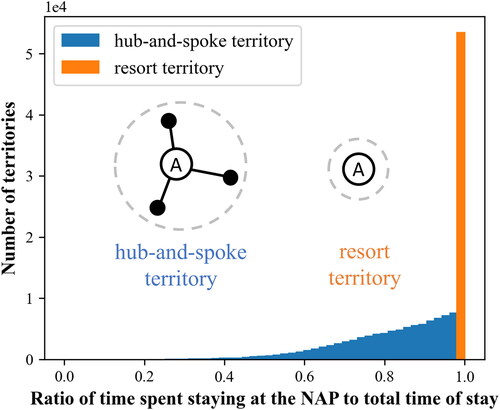
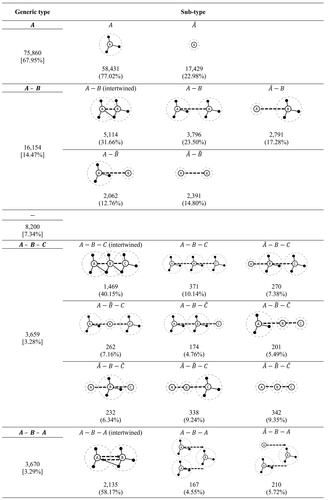
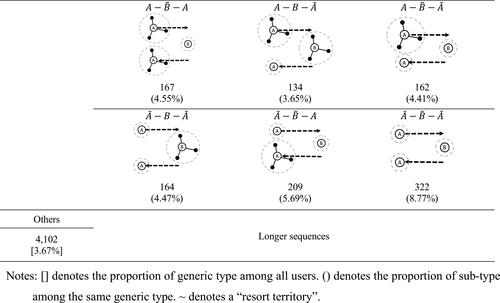
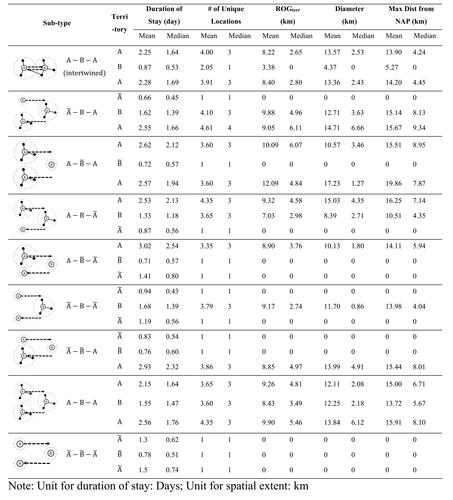
Figure 6. Spatiotemporal characteristics of subtypes: Single-NAP travelers () and double-NAP travelers (
).
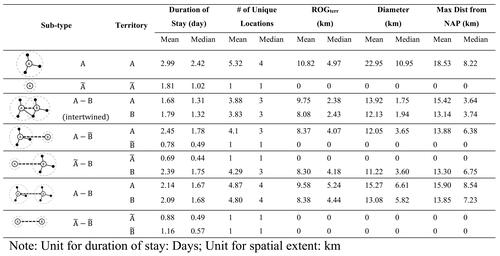
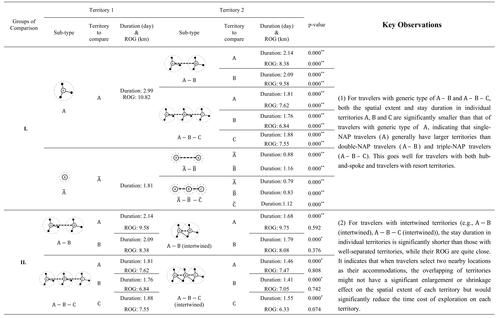
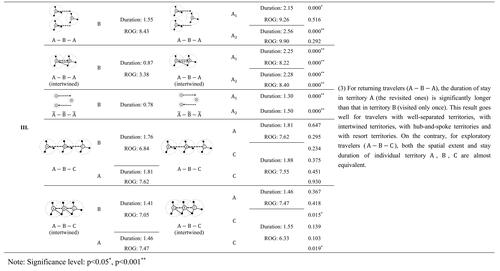
Figure 8. Time evolution of spatial extent of activity space: (A–B) Time evolution of the absolute spatial extent of the whole journey and each territory. (C–D) Time evolution of the normalized spatial extent of the whole journey and each territory.
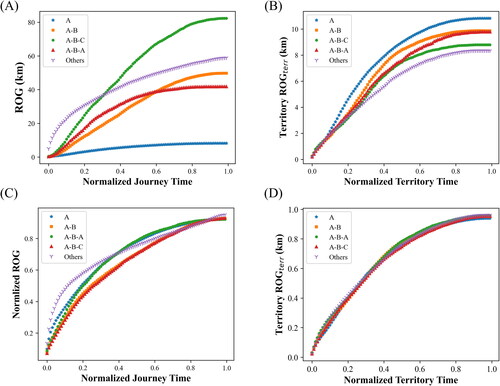
Figure A.1. Spatial and temporal characteristics of subtypes: Exploratory travelers ().
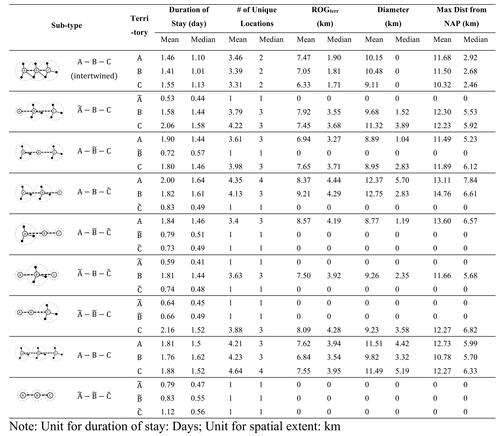
Figure A.2. Spatial and temporal characteristics of subtypes: Returning travelers ()