Figures & data
Table 1. Basic subject information.
Figure 1. The segment from t1 to t2 represents acceleration.
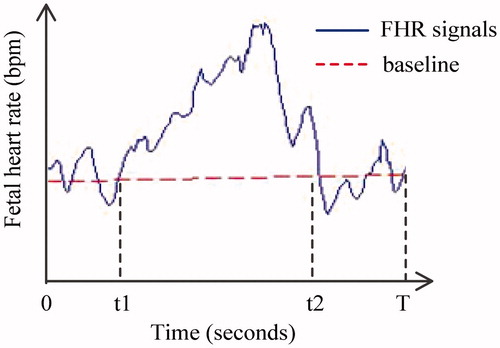
Table 2. Feature result comparison.
Figure 2. The number of accelerations in 20 min.
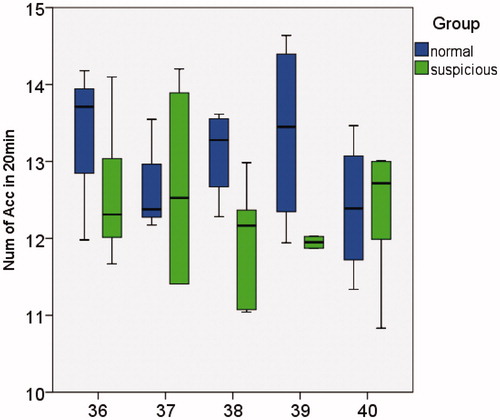
Figure 3. The length of accelerations in 20 min.
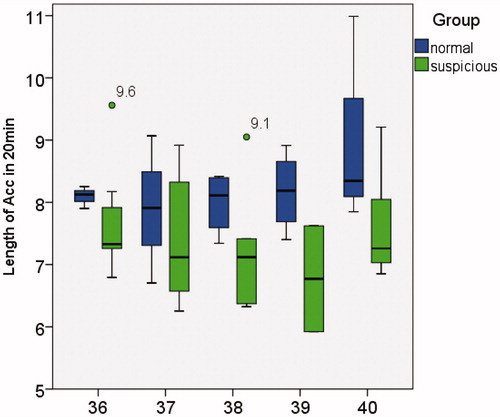
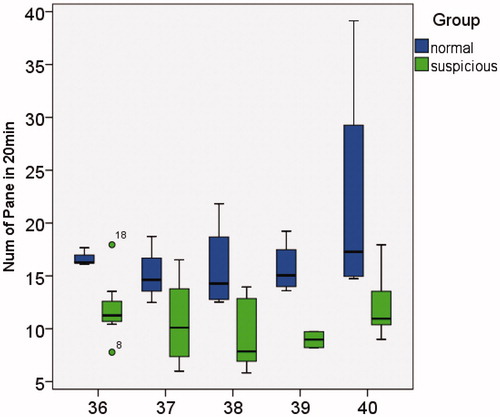
Figure 4. The number of grids covered by acceleration area in 20 min.