Figures & data
Figure 1. F-BVP divided by the maximum point. The abscissa is time; the ordinate is the amplitude of F-BVP. Q(t) indicates F-BVP waveform; T indicates full cardiac cycle time; Tm indicates the time of the maximum point of F-BVP waveform; Qmax, Qmin, and Qm indicate the maximum, minimum, and the mean values of the F-BVP waveform, respectively; Qm1 and Qm2 are the mean value of the F-BVP waveform before and after the maximum point, respectively; S1 and S2 represent the areas under the two parts of the waveform divided by the maximum point.
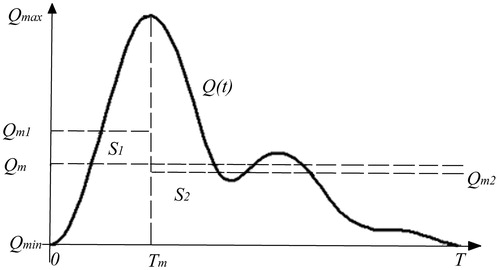
Table 1. The basic characteristics of the subjects.
Figure 2. Receiver operating characteristic (ROC) curve of waveform index (WI).
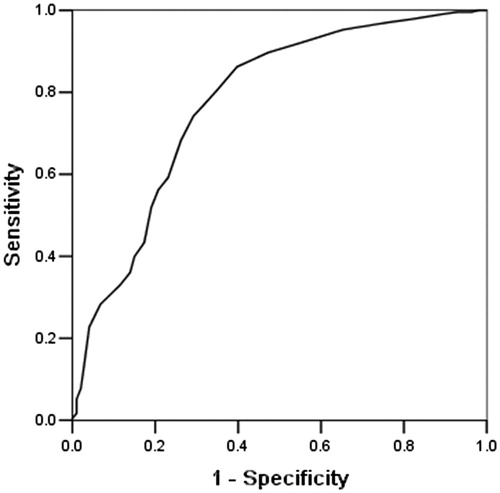
Figure 3. Box-plot figure of waveform index (WI) with the increase of age.
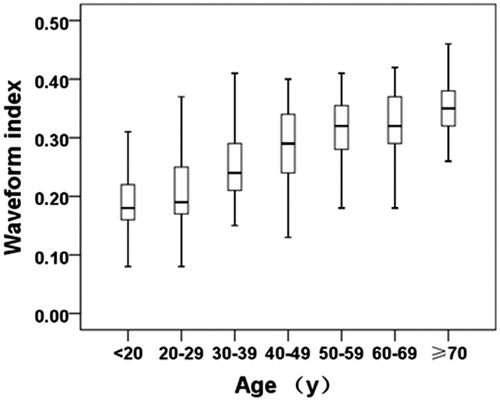
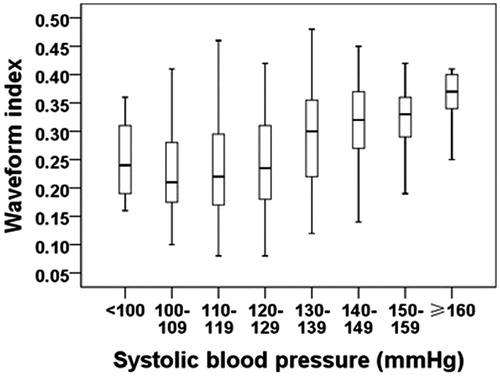
Figure 4. Box-plot figure of waveform index (WI) with the increase of systolic blood pressure.