
Figures & data
Figure 1. Measurement sites were centers of upper-arm and forearm. Three points were marked before measurement (A) the midpoint of the medial and lateral epicondyles, (B) the midpoint of the bicipital groove, (C) the midpoint of the radial and ulnar styloid processes). Two points were measured with ultrasonography 10 cm proximal and distal from A. These points were on the lines between A and B and between A and C.
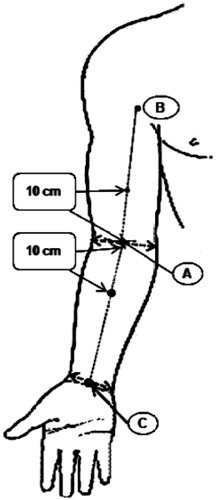
Figure 2. Ultrasonography (USG) with a linear transducer equipped with a pressure sensor was used to evaluate lymphedema tissue. Using a constant velocity controller, the arm was compressed down at a constant velocity using a precision instrument (0.8 mm/sec). The pressure signal was recorded in the computer using a data acquisition system.
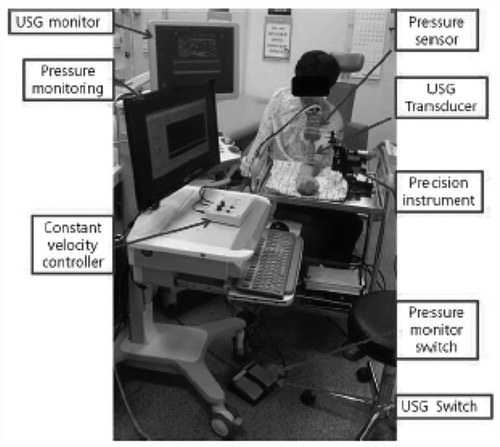
Figure 3. (A) Ultrasonographic B-mode and M-mode images were matched with real-time pressure measurements using Matlab. After confirmation of skin, subcutaneous tissue and muscle layer in B mode, M mode was started with pressure monitoring system. From the top of M mode, arrowhead is skin, arrow is subcutaneous tissue and the lighter gray space (curved arrow) is the muscle layer. Pressure increased constantly until the thickness of subcutaneous layer no longer changed. (B and C) It plotted the real-time change in thickness and force over time. Red and green lines are the thickness of subcutaneous tissue and skin with time. The blue line is the change of compressive force with time.
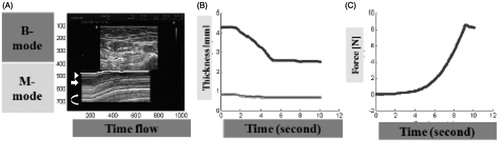
Table 1. Demographic characteristics of patients with lymphedema who underwent ultrasonographic measurements.
Table 2. The thickness and the ratio of thickness change in upper arm and forearm by compression in healthy subjects.
Table 3. Comparison of the thickness and the ratio of thickness change between unaffected and affected sides in upper arm and forearm by compression in lymphedema patientsTable Footnotea.
Table 4. Reliabilities of the thickness and the ratio of thickness in upper arm and forearm by compression in healthy subjectsTable Footnotea.
Table 5. Reliabilities of the thickness and the ratio of thickness in upper arm and forearm by compression in lymphedema patientsTable Footnotea.