
Figures & data
Figure 1. Displacement parameters identified in lateral and AP views.
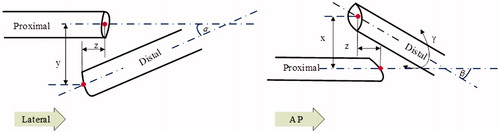
Figure 2. Definition of the local coordinate system of the fracture and the experimental setup for our measurement device.
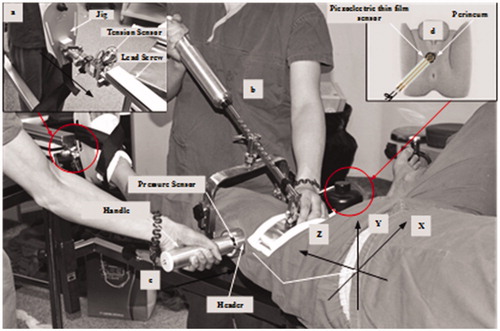
Figure 3. ‘F-arm’ used to reduce the fracture deformity along the Y-axis.
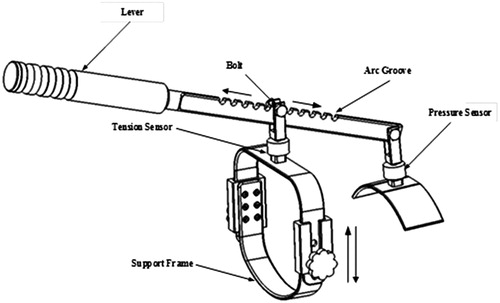
Figure 4. Data acquisition system.
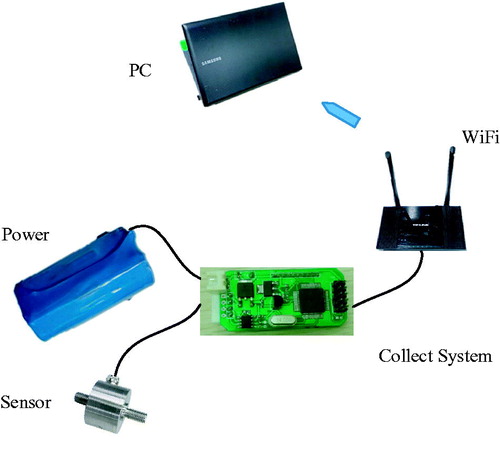
Figure 5. Intraoperative force–torque measurements.
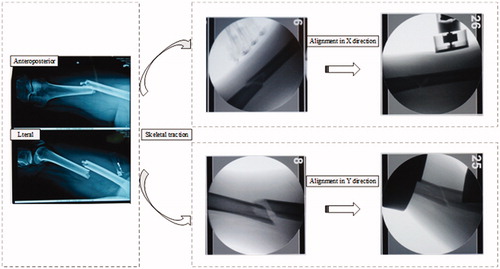
Table 1. Maximal forces and torques measured during fracture reduction.
Figure 6. Changes in the traction force measured over the entire fracture reduction procedure.
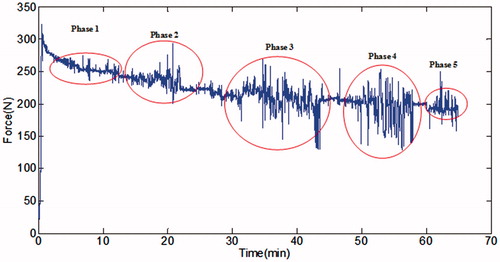
Figure 7. Traction force expressed as a function of the five stages of fracture reduction and fixation for three representative tests.
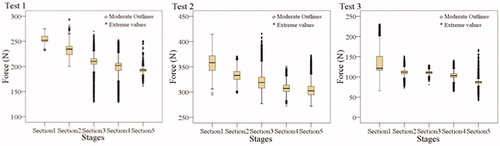
Table 2. Percentage of outlier values for each phase of the reduction and fixation procedure.
Table 3. Percentage of force reduction for each phase of the reduction and fixation procedure.