
Figures & data
Figure 1. The TM structure diagram.
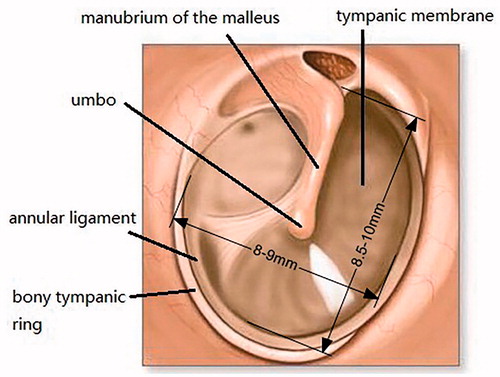
Figure 2. The simplified TM structure.
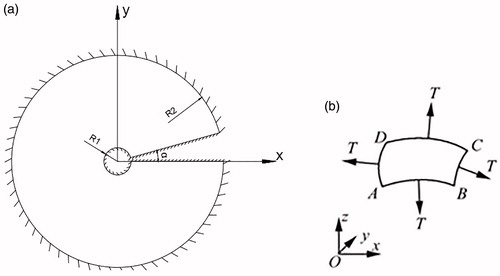
Table 1. Natural frequency and natural vibration mode of TM from theoretical solution.
Figure 3. The natural frequency when k fixed.
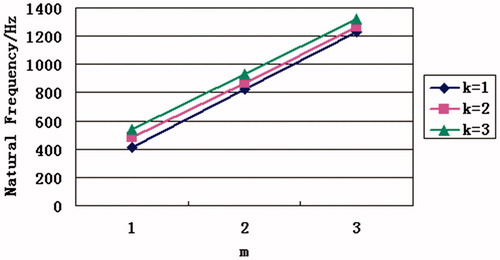
Figure 4. The natural frequency when m fixed.
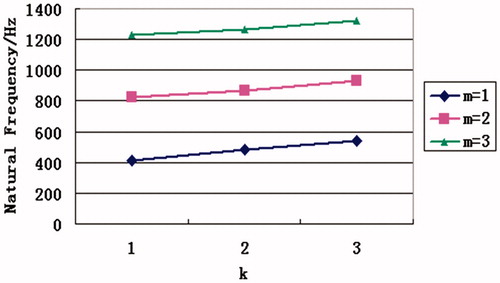
Figure 5. Sweep frequency curve of TM under the different sound power.
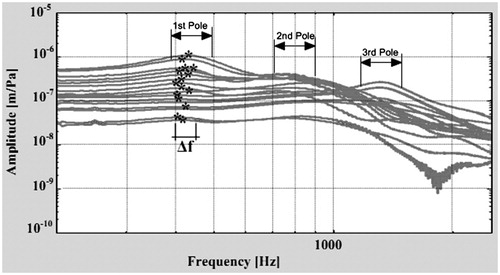
Table 2. Comparison between theoretical method and experimental data.