Figures & data
Figure 1. Weight-bearing alignment as described by Noyes et al. [Citation10–12,Citation25]. The medial edge is designated as 0% and the lateral edge as 100%. A line is drawn from the center of the femoral head to the center of the tibiotalar joint and is measured at the point where the line intersects the tibial plateau.
![Figure 1. Weight-bearing alignment as described by Noyes et al. [Citation10–12,Citation25]. The medial edge is designated as 0% and the lateral edge as 100%. A line is drawn from the center of the femoral head to the center of the tibiotalar joint and is measured at the point where the line intersects the tibial plateau.](/cms/asset/b0a6ab70-a356-45c3-ae6e-db9ab25389c7/icsu_a_1271909_f0001_b.jpg)
Table 1. Demographic characteristics of patients treated with medial open wedge HTOTable Footnotea.
Figure 2. Pre- and post-operative weight-bearing line for the navigated group. Circles are pre-operative values and squares post-operative values. The bar represents the target for correction (50–75%).
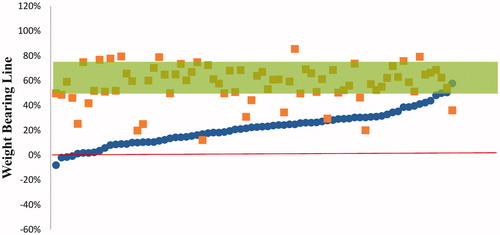
Figure 3. Pre- and post-operative weight-bearing line for the conventional group. Circles are pre-operative values and squares are post-operative values. The bar represents the target for correction (50–75%).
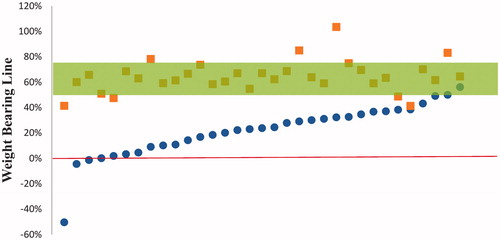
Table 2. Post-operative radiographic and clinical results.
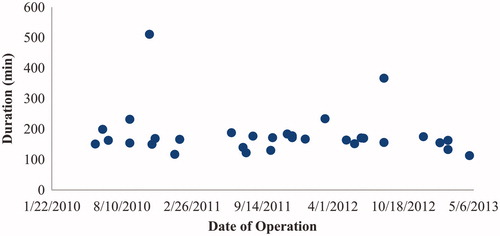
Figure 4. Duration of operation in the navigated group plotted over time. Each circle represents a single operation.