Figures & data
Figure 1. (a) Illustration of the continuous tracking task. (b) The schematic representation of the experiment on each day.
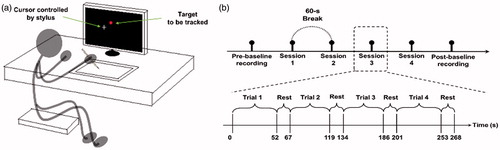
Figure 2. Mean RMSE of three segments in each trial on both days.
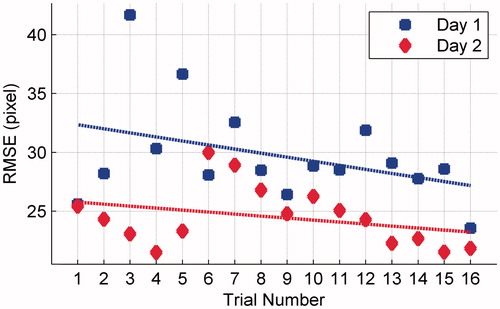
Figure 3. The time course of relative EEG amplitudes in eight frequency bands on both days. (pre: pre-baseline, post: post-baseline).
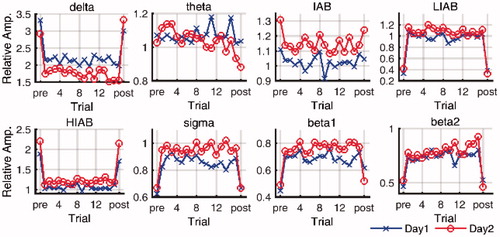
Figure 4. Mean difference of the relative EEG amplitudes between pre-baseline and active state on (a) Day1 and (b) Day2. (pre-baseline - active state).
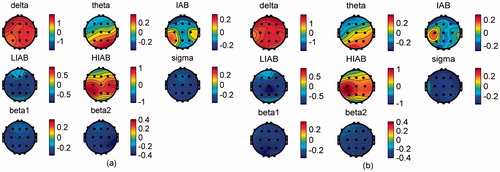
Figure 5. P value of paired sample t test of the relative EEG amplitudes in the active state comparison between Day1 and Day2.
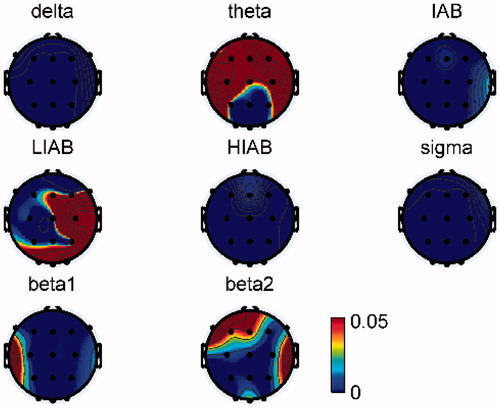
Figure 6. Mean difference of the relative EEG amplitudes across trials between two days. (Day1-Day2).
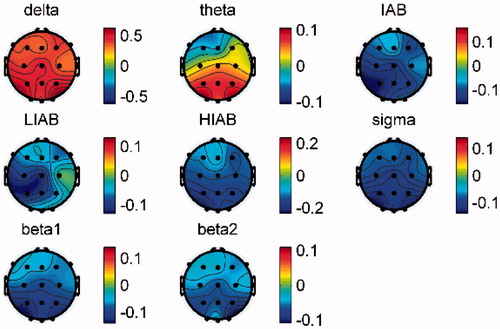
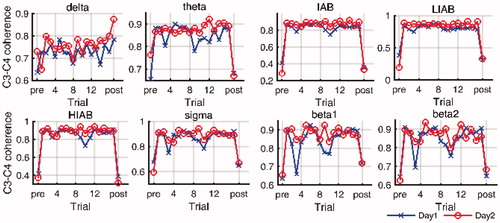
Figure 7. The time course of EEG coherence in eight frequency bands on both days. (pre: pre-baseline, post: post-baseline).