
Figures & data
Table 1. Patients characteristics.
Table 2. List of customized features.
Figure 1. An example of segmentation result of glioma. (a) Segmentation results of a piece of T1 Contrast MRI image and (b) segmentation results in three dimensions.
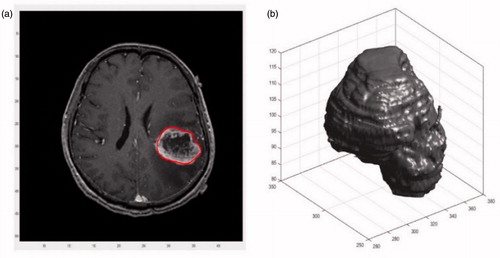
Figure 2. Boxplot result of a remarkable feature. (p value =0.001).
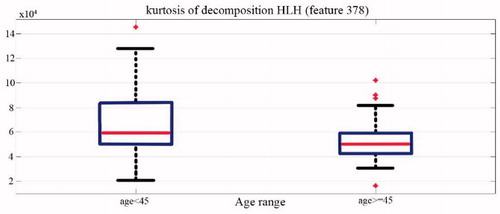
Table 3. Five highly correlated features to age group.
Figure 3. Radiomics heat map. (a) Unsupervised hierarchical clustering of 101 image features from 96 glioblastoma patients. Quantitative imaging features were normalized [0, 1], then clustered linking with Euclidean metric distance. (b) Selected radiomics features corresponding to the age group. (c) Cluster results show strong consistency with age grouping (T test, p value =0.006).
![Figure 3. Radiomics heat map. (a) Unsupervised hierarchical clustering of 101 image features from 96 glioblastoma patients. Quantitative imaging features were normalized [0, 1], then clustered linking with Euclidean metric distance. (b) Selected radiomics features corresponding to the age group. (c) Cluster results show strong consistency with age grouping (T test, p value =0.006).](/cms/asset/23f67e8c-d9bd-41d3-be9a-27a6bfa2bf72/icsu_a_1378722_f0003_c.jpg)