
Figures & data
Figure 1. The operation part of MIS instrument: end-effector with the tip point and shaft with the insertion point.
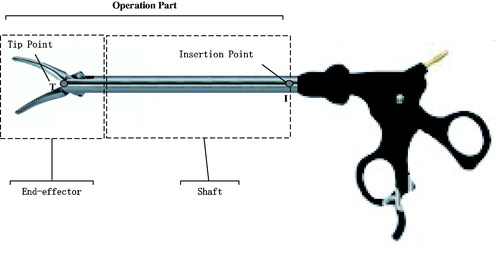
Figure 2. Line scanner application for detection of shaft edge lines and shaft image direction estimation.
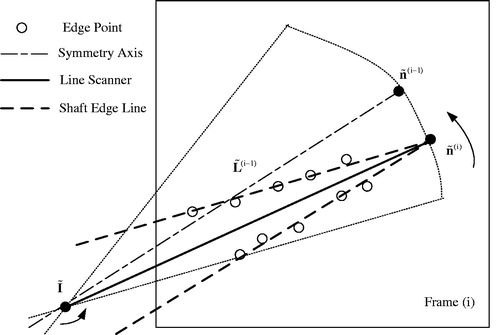
Figure 3. The CNN architecture for the end-effector detection consisting of 5 convolutional (conv1 ∼ 5) and 2 fully connected (fc6 ∼ 7) layers.
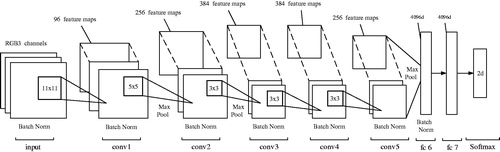
Figure 4. The 2D trajectories of end-effector tip obtained by the proposed method (solid lines) and that in [Citation7] (dash-dotted lines).
![Figure 4. The 2D trajectories of end-effector tip obtained by the proposed method (solid lines) and that in [Citation7] (dash-dotted lines).](/cms/asset/04ffc801-a402-440f-84f5-040a3f5074de/icsu_a_1378777_f0004_c.jpg)
Figure 5. The end-effector tip 3D trajectories in X-Y-Z coordinates.
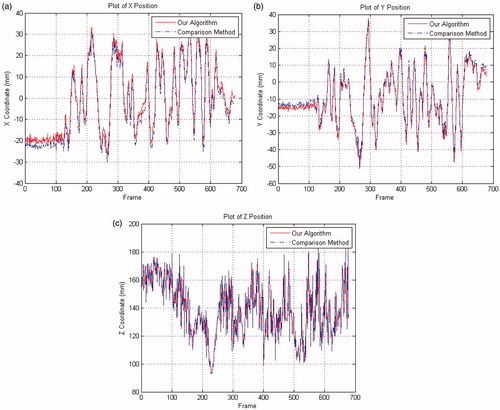
Figure 6. The end-effector tip 3D errors in the X-Y-Z coordinates.
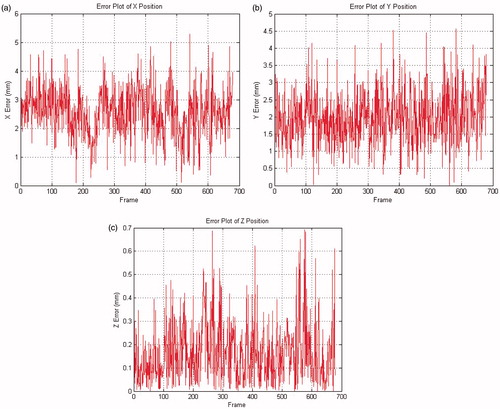
Figure 7. Selected frames of the instrument tracking and detection: the red circles are the tracked end-effector tip position, and the green dashed line is the shaft symmetry axis.
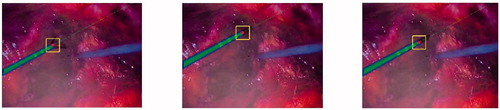
Table 1. The mean errors and standard deviations for 2D/3D numerical results obtained by the proposed method.
Figure 8. Example frames of in-vivo sequences with the end-effector positions shown by squares.
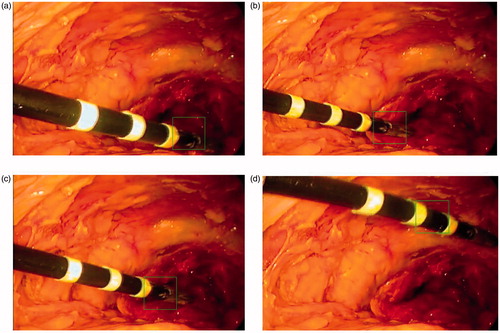
Table 2. The 2D mean errors and standard deviations of in-vivo test.