Figures & data
Table 1. The Taguchi’s unique orthogonal array of L18 (21 ×35), a total of 486 (2 × 3 × 3 × 3 × 3 × 3= 486) different combinations were considered.
Table 2. Six factor combination in every group according to the Taguchi’s recommendation.
Figure 1. The CT simulator and Catphan 600 module CTP 404 as applied in this work. (A) depicts the CT simulator, PHILIPS/MARCONI ACQSIM CT Single-slice with a flat couch to easy locate the auxiliary tool for precise positioning the patient for treatment planning, (B) is the close up view of the Catphan 600 phantom with module CTP404 inside, and (C) is the CT scanned profile of module CTP 404, the marked numbers corresponding to seven materials, such as air, PMP, LDPE, Polystyrene, Acrylic, Delrin and Teflon in the sequential order.
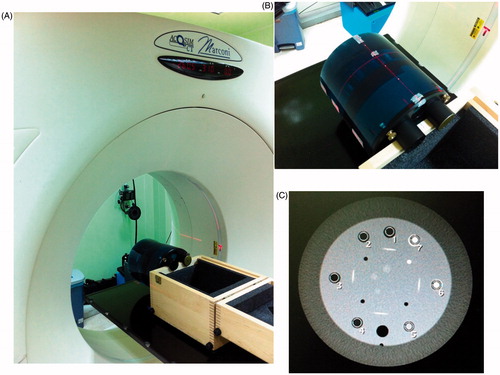
Figure 2. The derived linear regression fit of every group. As clearly depicted, every regressed fit had high coefficient of determination (r2 ∼1.000) and the slope (i.e. sensitivity, m) fluctuated from 975 (group 7) to 1049 (group 1).
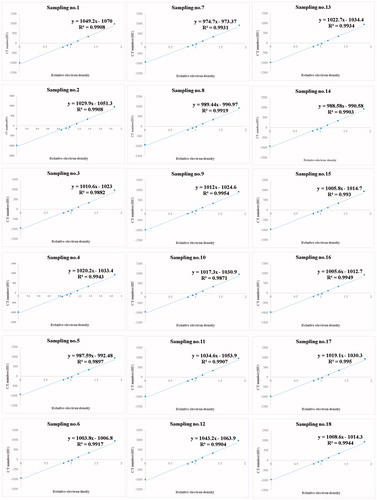
Table 3. The derived data from the CT simulator and the correlated calculations of sensitivity, stdev, and S/N. the data were averaged from three independent CT scanning.
Figure 3. The sensitivity, standard deviation (stdev), and S/N versus six factors, respectively. Apparently, the CT simulator performance is controlled by dominating factors kVp or FOV.
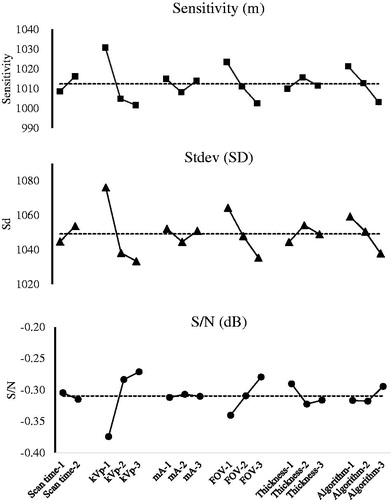
Figure 4. The difference between conventional and optimal settings of the CT simulator in this work. The straight linearity of the ρm-HU calibration provides a reliable optimization result.
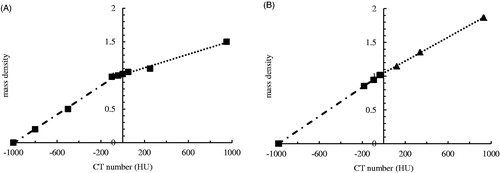
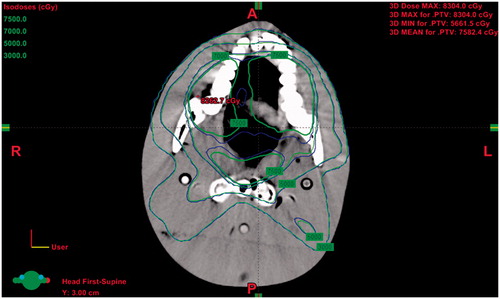
Figure 5. The true isodose curve of CT scanned slice from a Rando phantom head. The green curve corresponds to the optimal ρm-HU calibration, whereas the blue one is derived by TPS.