
Figures & data
Figure 1. The experimental models of the (a) LED, (b) HFFU and (c) combinational LED and HFFU treatment using HeLa cells.
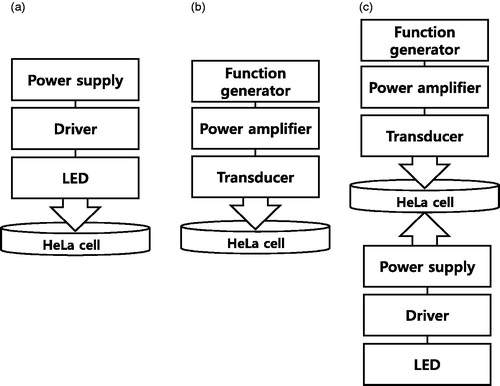
Figure 2. Schematic design of (a) guide, (b) top and (c) bottom view of the guide.
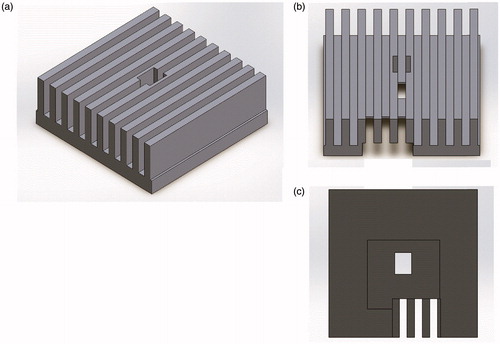
Figure 3. Representative images of cell density calculation using (a) an acquired brightfield image and (b) cell boundary traced image using the MATLAB program. The boundary is marked by the red solid line.
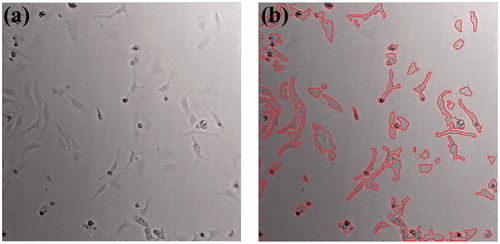
Figure 4. The brightfield images acquired using an inverted microscope. From top, image of Hela cells without any stimulus as a control group, Red-LED 30 MIN group, Green-LED 30 MIN group, Blue-LED 30 MIN group, HFFU-30 MIN group, and Blue-LED + HFFU 30 MIN group represents the HeLa cell exposed by red, green, and blue LED lights only, HFFU only, and combined blue-LED + HFFU for 30 min, respectively.
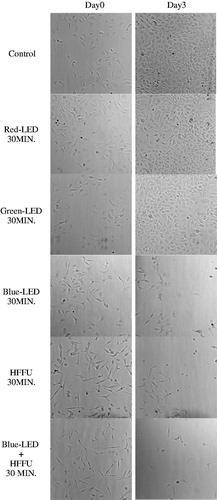
Figure 5. The experimental results of the cell density when using Red, Green and Blue LED lights. Control group of the HeLa cell is represented by black color. The HeLa cell groups when using red, green and blue LED light are represented by red, green and blue color bar, respectively. *p < 0.05.
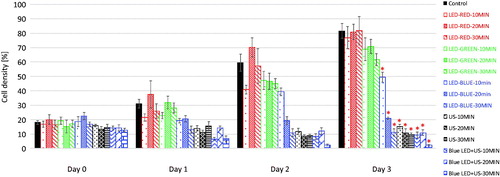
Figure 6. The selective experimental results of the cell densities when using red LED, green LED, blue LED and Blue LED + HFFU stimuli on each day. The black bar represents the control group of HeLa cells. *p < 0.05.
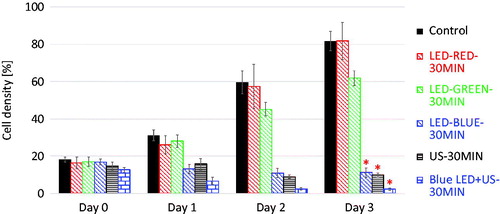
Table 1. The numerical data of the experimental cell density results.