Figures & data
Figure 1. Volumetric 3 D IVUS reconstruction algorithm to visualize a curved artery.
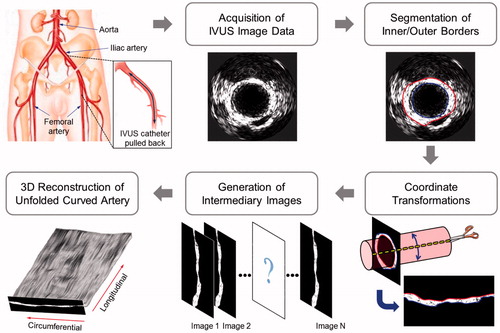
Figure 2. Schematic diagram of the intermediary IVUS image generation algorithm.
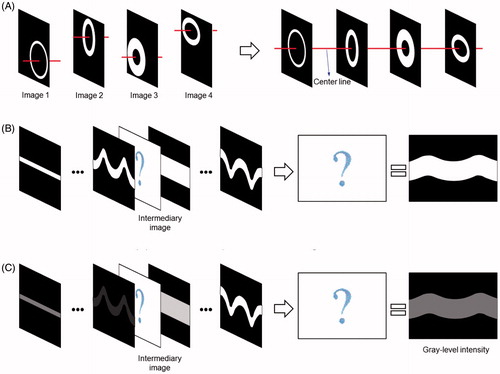
Figure 3. A 3 D curved arterial phantom containing varying cross-sectional shapes, wall thicknesses and grayscale values.
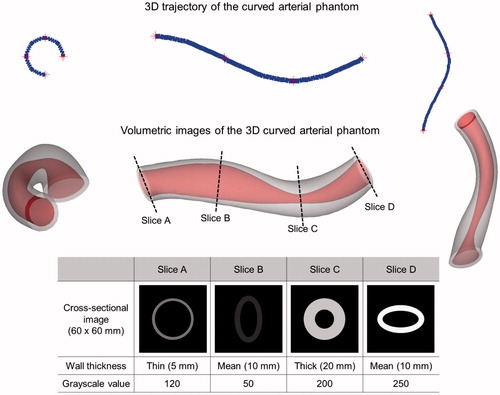
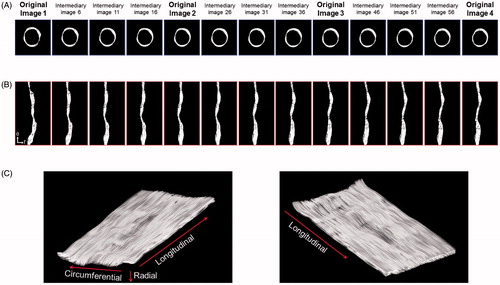
Figure 4. Validation studies using the 3 D curved arterial phantom displaying the changes in wall thickness and grayscale value.
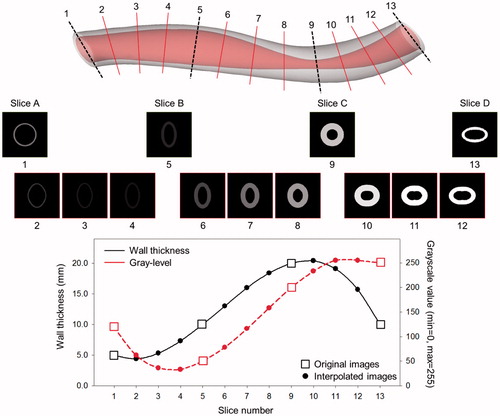
Figure 5. Cross-sectional 2 D images and volumetric 3 D visualization of the unfolded curved arterial phantom (r: radial, θ: circumferential).
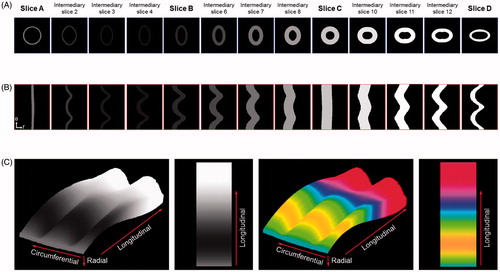
Figure 6. Intermediary IVUS image generation and volumetric 3 D IVUS visualization of the unfolded curved iliofemoral artery (r: radial, θ: circumferential).