Figures & data
Figure 1. Selected optical coherence tomographic cross sections of coronary artery lumen matching the centerline of coronary angiography.
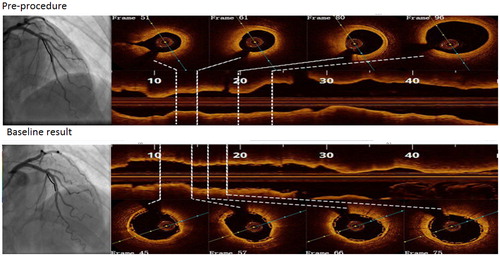
Figure 2. (a) 3 D model of the stent comprising the stent point cloud. (b) The coronary artery models were created by fusing optical coherence tomography and angiography.
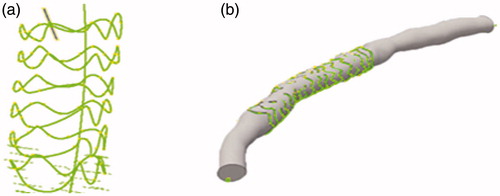
Figure 3. (a) Local enlargement of volume meshes. (b) 3D geometry of the coronary artery.
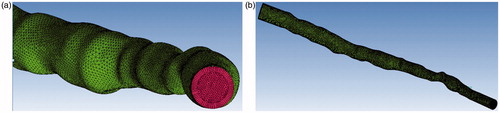
Figure 4. Profile of inlet flow waveforms during the cardiac cycle.
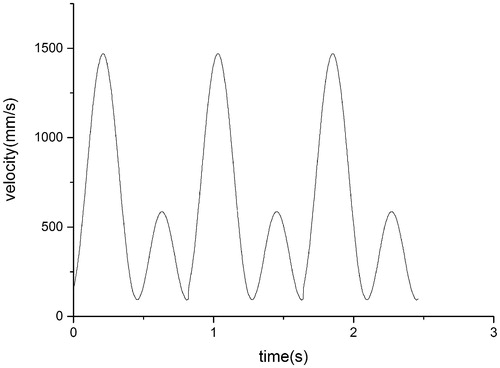
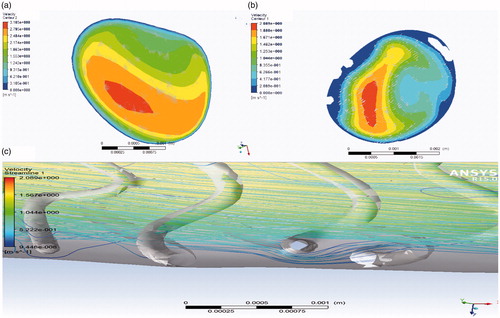
Figure 5. Coronary artery stenosis (a) and downstream segment (b).
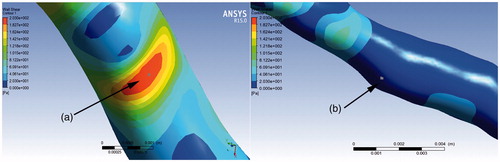
Figure 6. WSS at different moments of isolated and realistically stented coronary artery.
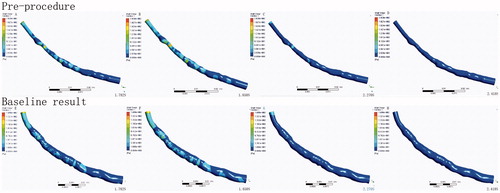
Table 1. Distribution of WSS at points A and B (refer to ) of two patient-specific models.
Figure 7. Wall pressure at different moments of isolated and realistically stented coronary artery.
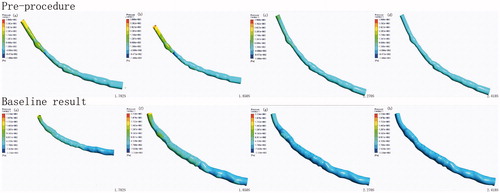
Figure 8. (a and b) Comparison of blood flow velocity of isolated and realistically stented coronary artery at point A. (c) Obstacle to the blood flow around the stent struts on the streamlines.