
Figures & data
Figure 1. Overview of the whole image approach and calculation.
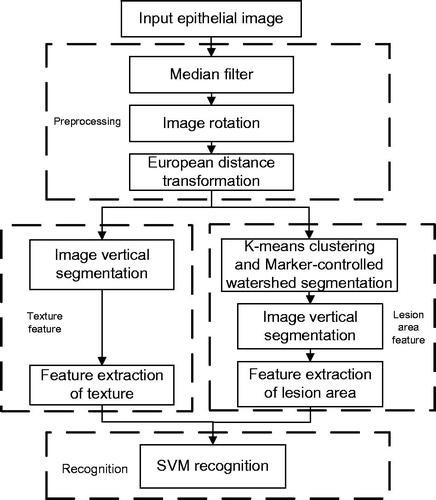
Figure 2. The CIN grading image samples. (a)Normal, (b) CINII, (c) CINIII, (d) Cervical Cancer.
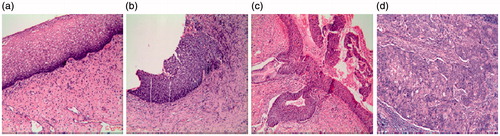
Figure 3. (a) Original image, (b) Rotated original image, (c) Part of image from (b).
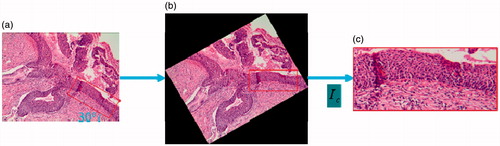
Figure 4. Euclidean distances transform. (a) The binary image IcB, (b) Distance transform image IcE.
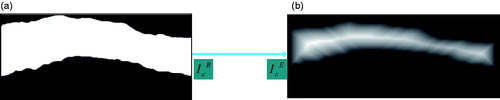
Figure 5. The four types of points. (a) Regular point, (b) Branching point, (c) Boundary point, (d) Arc point.
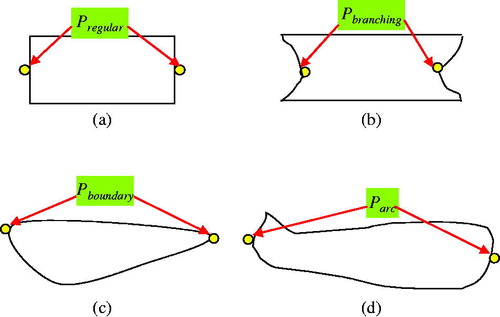
Figure 6. Create medial axis. (a) The highest intensity pixel, (b) line transform based on step 2 and step 3.
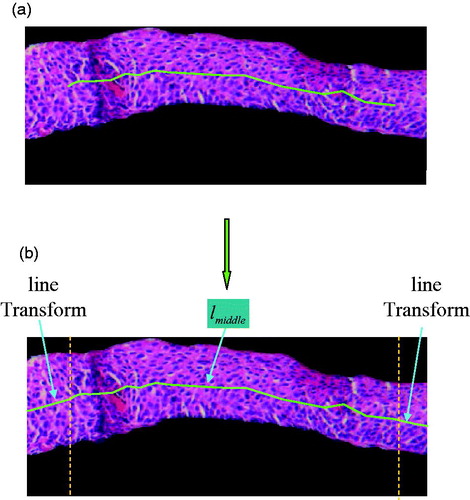
Figure 7. Ten vertical image regions (L1,L2,…,L10).
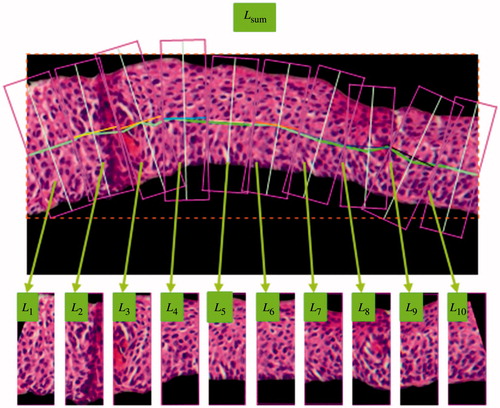
Figure 8. Contrast.
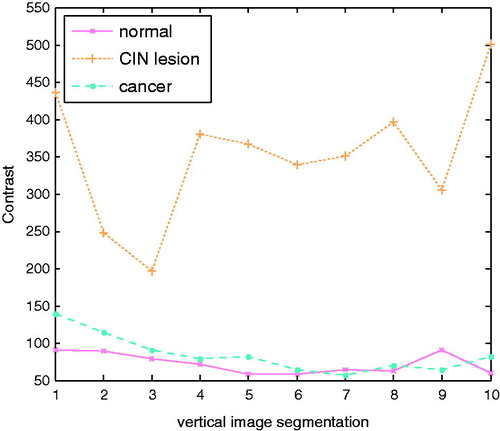
Figure 9. Correlation.
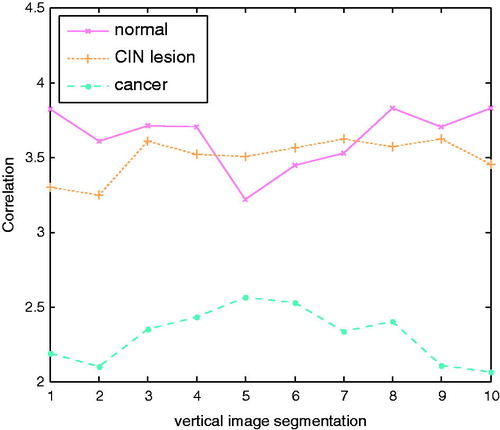
Figure 10. Entropy.
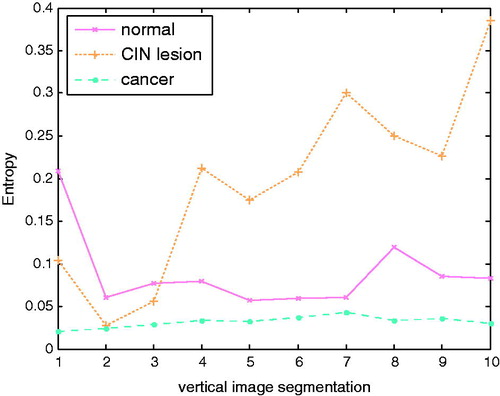
Figure 11. Homogeneity.
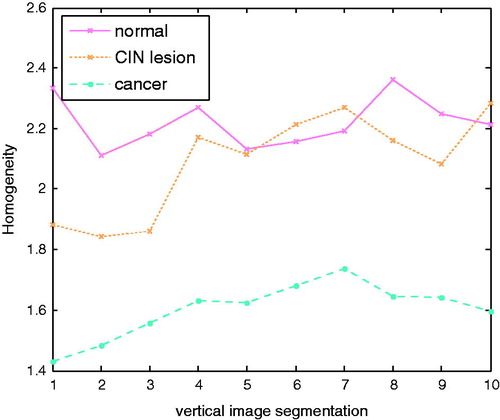
Figure 12. Angular Second Moment.
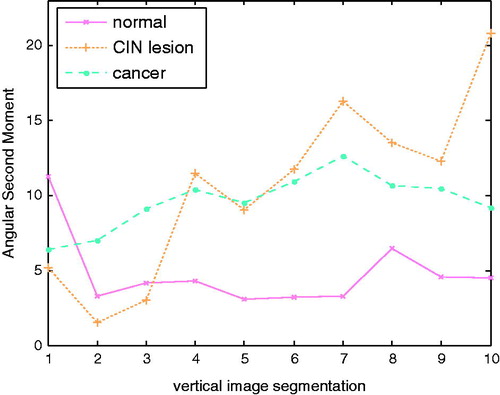
Figure 13. Marker-controlled watershed results with different thresholds. (a) T=15, (b) T=30, (c) T=45, (d) T=80.
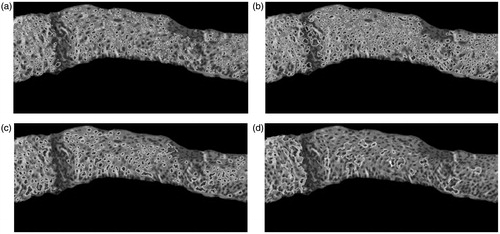
Figure 14. The image segmentation. (a) original image, (b) image segmentation.
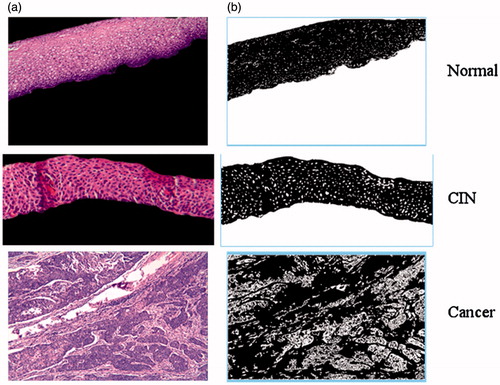
Figure 15. Morphological operation on the tissue. (a) Image with preliminary nuclei tissue, (b) Image with holes filling.
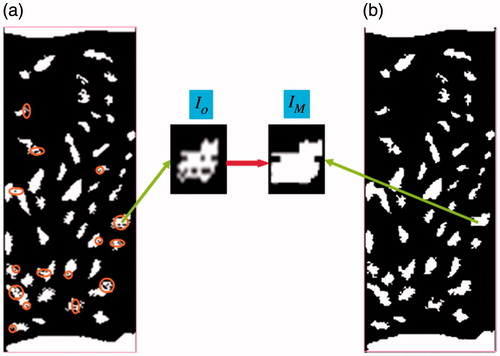
Figure 16. The result of image segmentation.
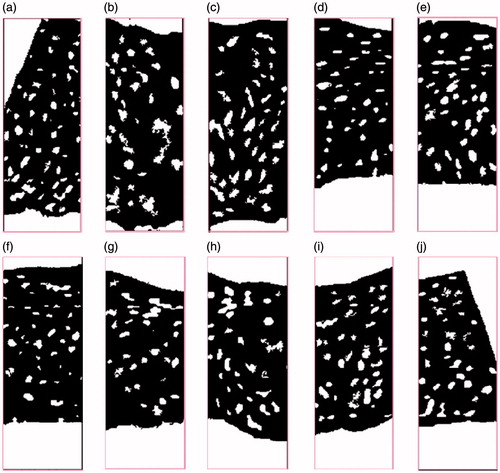
Figure 17. Three layers.
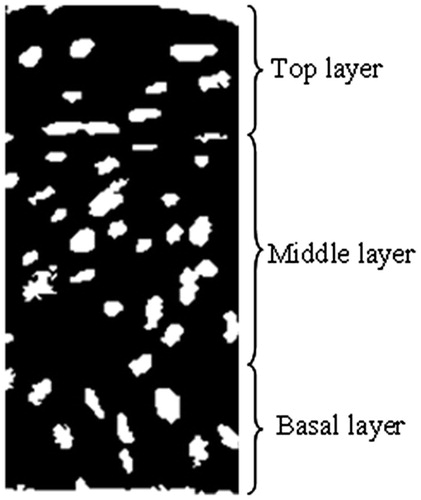
Figure 18. The area of top layer.
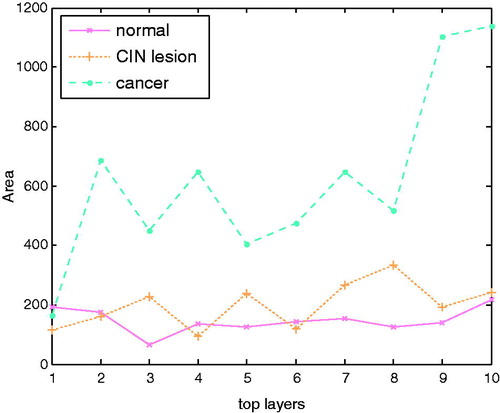
Figure 19. The area of middle layer.
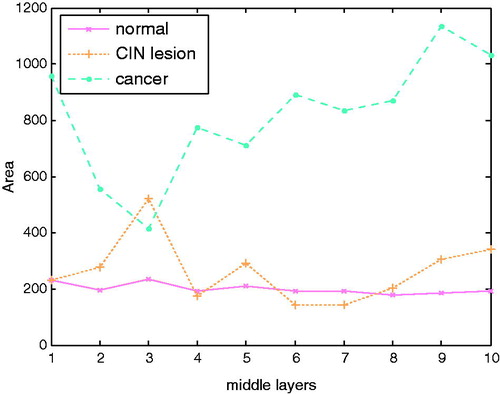
Figure 20. The area of basal layer.
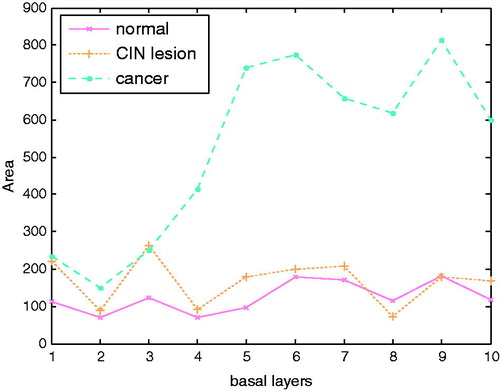
Table 1. The result of normal layers areas.
Table 2. The result of CIN lesion layers areas.
Table 3. The result of cancer layers areas.
Table 4. The recognition result of cervical cancer.
Table 5. The result of different methods.