
Figures & data
Figure 1. Schematic of a typical intra-ventricular assist device.
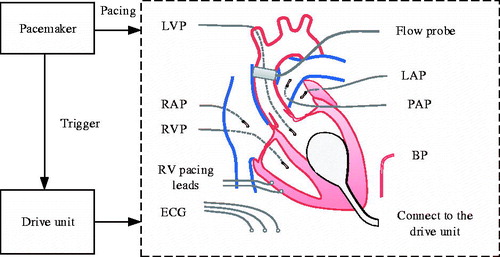
Figure 2. Illustration of the pulsatile rhythm of the left ventricle and the iVAD.
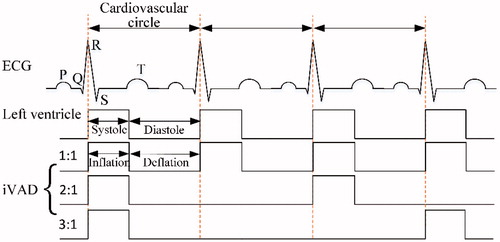
Figure 3. The cardiovascular circuit model.
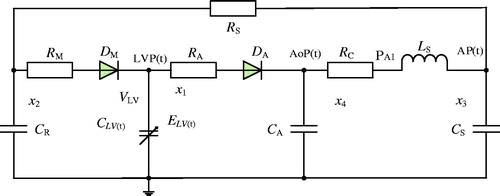
Figure 4. Graphs indicating the elastance function: (a) Normalized elastance; (b) Healthy heart elastance.
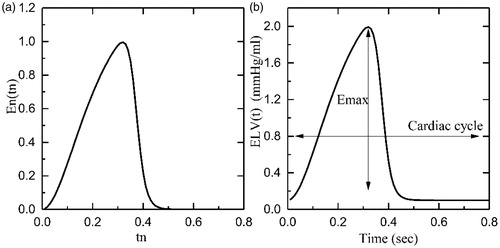
Table 1. Variables in the cardiovascular system model.
Table 2. Model parameters.
Figure 5. Schematic of a mock cardiovascular system.
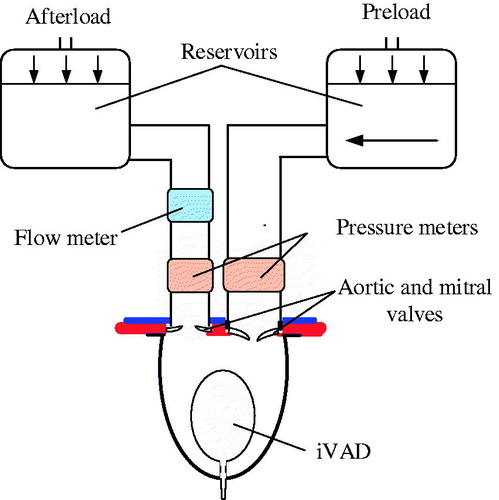
Figure 6. The elastance curves of the pump: (a) Ep(t) under different drive pressure; (b) Epn(tn).
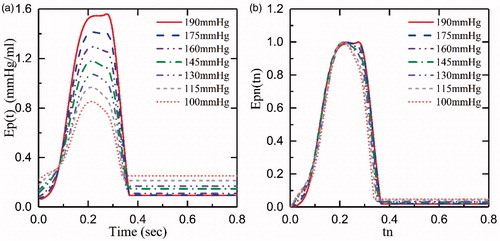
Figure 7. The Ep(t) and Epn(tn) of different afterload at 75bpm and 145 mmHg drive pressure: (a) Ep(t), iVAD’s elastance; (b) Epn(tn), the normalized elastance.
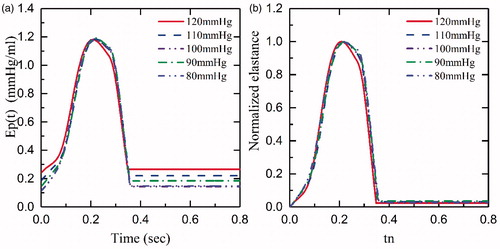
Figure 8. Ep(t), Epn(tn) curves of different heart rates: (a) Ep(t), iVAD’s elastance, (b) Epn(tn), normalized elastance.
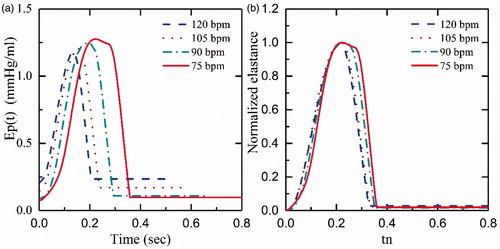
Figure 9. Epn(tn) showing 75 bpm and 145 mmHg curves: (a) Epn(tn); (b) fitting curve.

Figure 10. Epmax, Epmin curves of drive pressure.
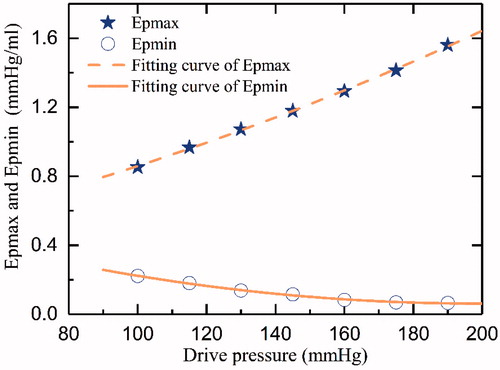
Figure 11. The cardiovascular cycle model combined with iVAD.
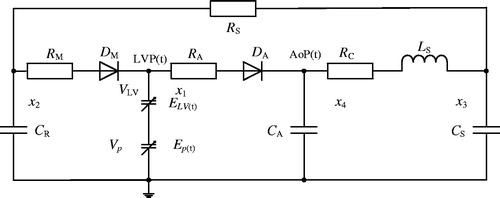
Figure 12. Hemodynamic parameters of the 4 categories of heart failure: (a) Pressure, (b) Aortic flow, (c) Pressure-volume loops.
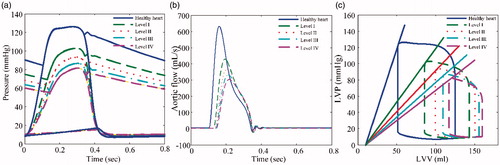
Figure 13. Hemodynamic parameters after iVAD assistance for the 4 categories of heart failure: (a) Pressure, (b) Aortic flow, (c) Pressure-volume loops.
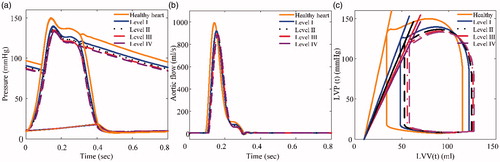
Table 3. Comparison of the simulation results of iVAD power off with iVAD power on.